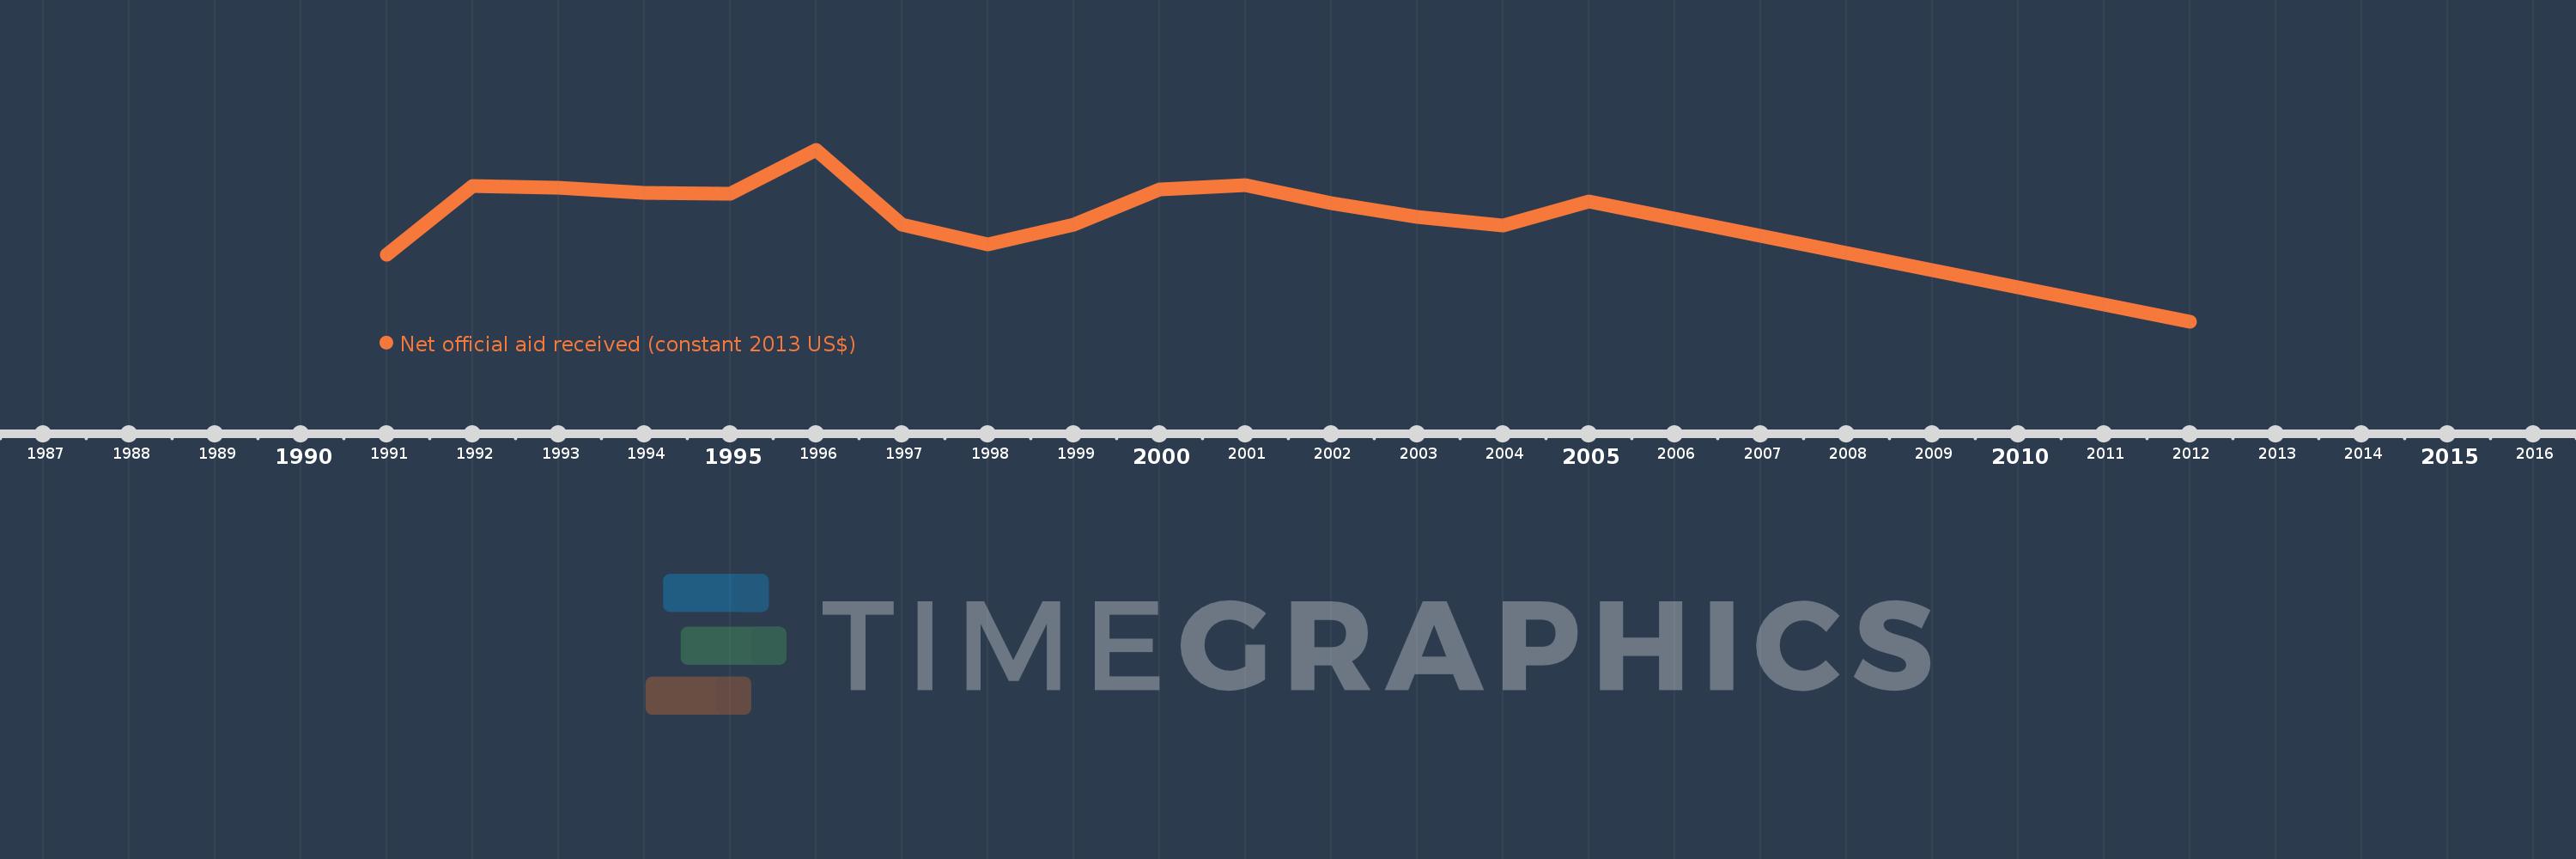
This timeline shows a graph from 1991 to 2012 of IDA & IBRD total. No data until 1990. Number of actual observations by date: 16.
Source name:
World Development Indicators
Source organization:
Development Assistance Committee of the Organisation for Economic Co-operation and Development, Geographical Distribution of Financial Flows to Developing Countries, Development Co-operation Report, and International Development Statistics database. Data are available online at: www.oecd.org/dac/stats/idsonline.
Categories, topics:
Aid Effectiveness
Last updated:
apr 23, 2017
Indicators value changes by year
Meaning:
5.341 bln
Minimum:
280.0K
jan 1, 2012
Maximum:
8.394 bln
jan 1, 1996
At the date of observation
Value
Absolute change
Change from the previous value
jan 1, 1991
3.305 bln
+3.305 bln
0.0%
jan 1, 1992
6.66 bln
+3.355 bln
101.5%
jan 1, 1993
6.563 bln
-97.18 mln
-1.46%
jan 1, 1994
6.298 bln
-265.62 mln
-4.05%
jan 1, 1995
6.286 bln
-11.29 mln
-0.18%
jan 1, 1996
8.394 bln
+2.108 bln
33.53%
jan 1, 1997
4.74 bln
-3.655 bln
-43.54%
jan 1, 1998
3.774 bln
-966.0 mln
-20.38%
jan 1, 1999
4.754 bln
+980.58 mln
25.99%
jan 1, 2000
6.468 bln
+1.714 bln
36.06%
jan 1, 2001
6.707 bln
+238.65 mln
3.69%
jan 1, 2002
5.8 bln
-907.0 mln
-13.52%
jan 1, 2003
5.134 bln
-666.09 mln
-11.48%
jan 1, 2004
4.693 bln
-441.25 mln
-8.59%
jan 1, 2005
5.879 bln
+1.187 bln
25.29%
jan 1, 2012
280.0K
-5.879 bln
-100.0%
Ranking of countries by current statistics by years