Download This statistics in other country:
Timeline:
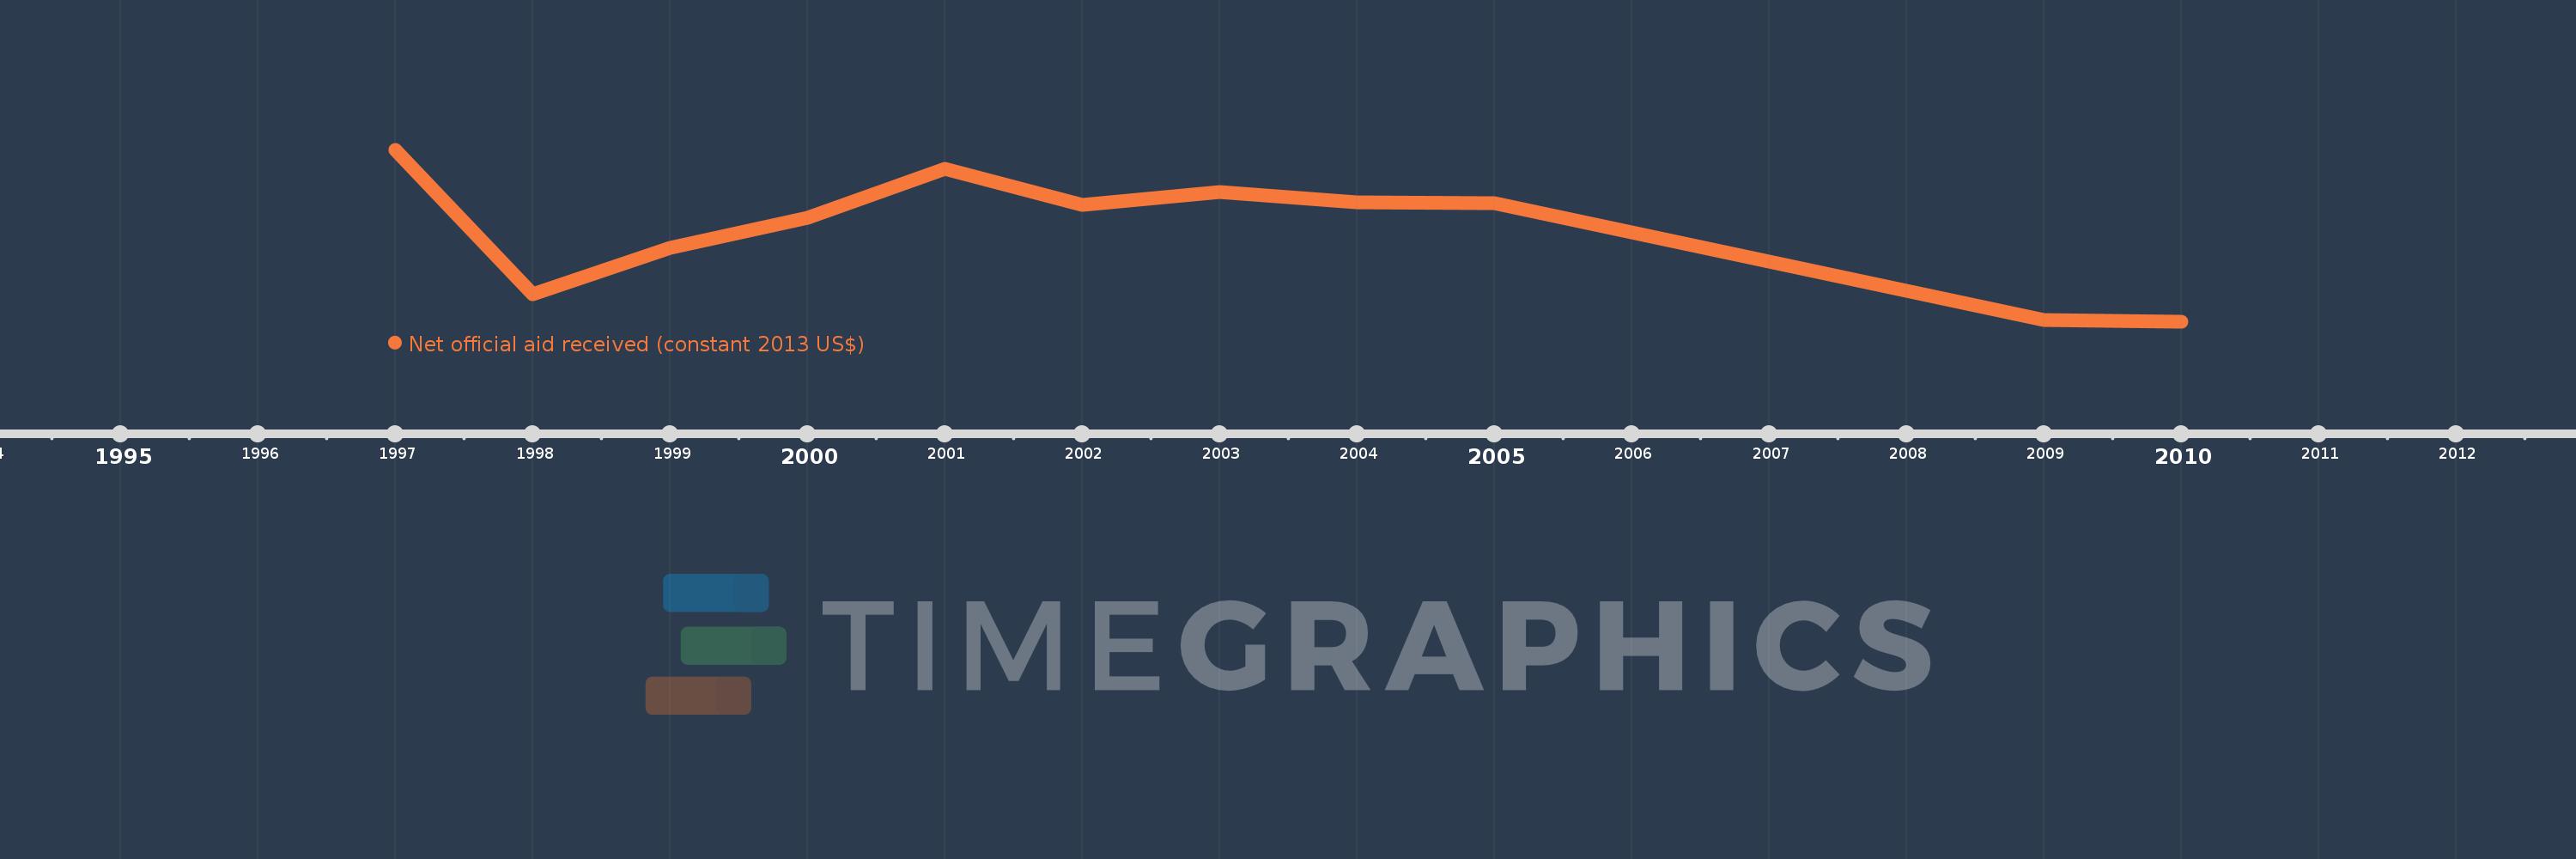
This timeline shows a graph from 1997 to 2010 of Arab World. No data until 1996. Number of actual observations by date: 11.
Source name:
World Development Indicators
Source organization:
Development Assistance Committee of the Organisation for Economic Co-operation and Development, Geographical Distribution of Financial Flows to Developing Countries, Development Co-operation Report, and International Development Statistics database. Data are available online at: www.oecd.org/dac/stats/idsonline.
Categories, topics:
Aid Effectiveness
Last updated:
apr 23, 2017
Indicators value changes by year
Minimum:
310.0K
jan 1, 2010
Maximum:
44.44 mln
jan 1, 1997
At the date of observation
Value
Absolute change
Change from the previous value
jan 1, 1997
44.44 mln
+44.44 mln
0.0%
jan 1, 1998
7.34 mln
-37.1 mln
-83.48%
jan 1, 1999
19.29 mln
+11.95 mln
162.81%
jan 1, 2000
27.11 mln
+7.82 mln
40.54%
jan 1, 2001
39.55 mln
+12.44 mln
45.89%
jan 1, 2002
30.32 mln
-9.23 mln
-23.34%
jan 1, 2003
33.72 mln
+3.4 mln
11.21%
jan 1, 2004
31.05 mln
-2.67 mln
-7.92%
jan 1, 2005
30.76 mln
-290.0K
-0.93%
jan 1, 2009
730.0K
-30.03 mln
-97.63%
jan 1, 2010
310.0K
-420.0K
-57.53%
Ranking of countries by current statistics by years