Download This statistics in other country:
Timeline:
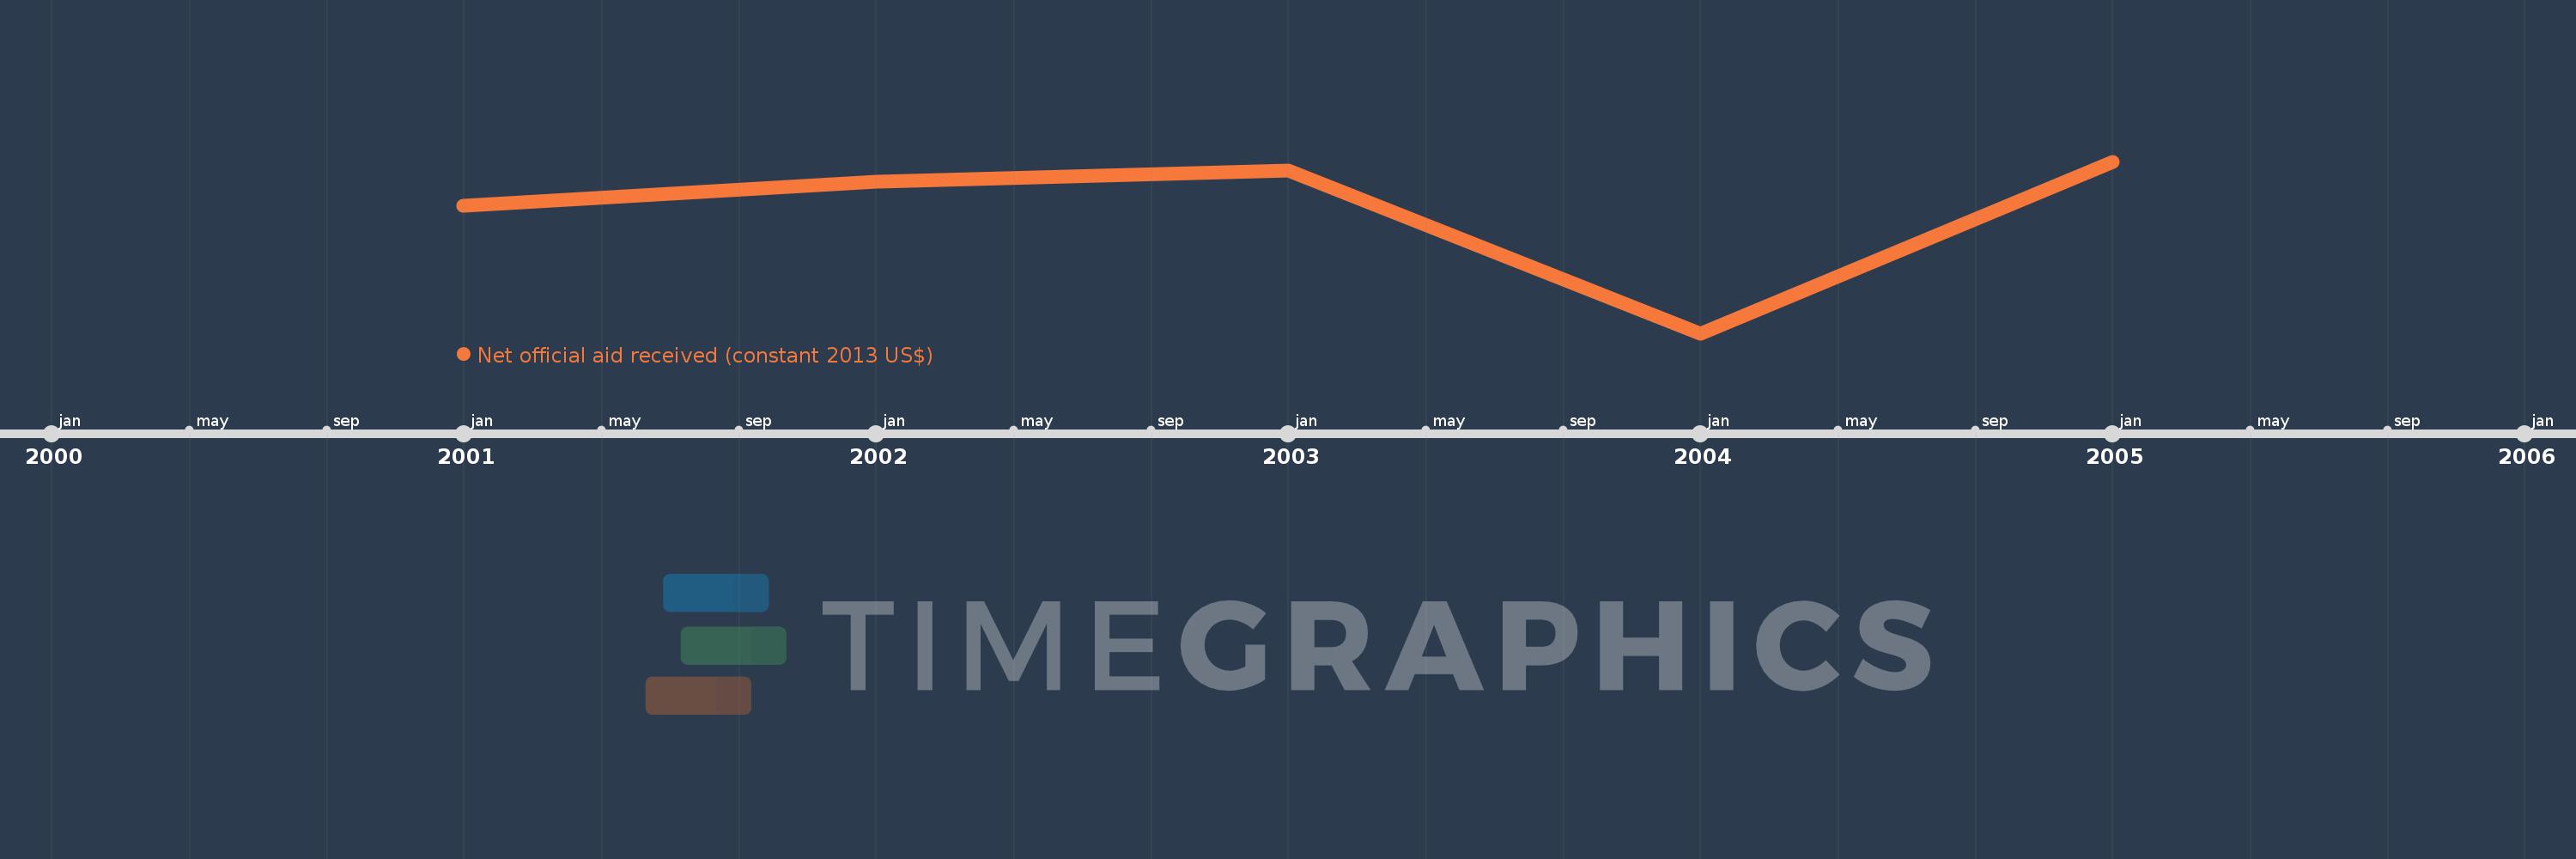
This timeline shows a graph from 2001 to 2005 of East Asia & Pacific (IDA & IBRD countries). No data until 2000. Number of actual observations by date: 5.
Source name:
World Development Indicators
Source organization:
Development Assistance Committee of the Organisation for Economic Co-operation and Development, Geographical Distribution of Financial Flows to Developing Countries, Development Co-operation Report, and International Development Statistics database. Data are available online at: www.oecd.org/dac/stats/idsonline.
Categories, topics:
Aid Effectiveness
Last updated:
apr 23, 2017
Indicators value changes by year
Minimum:
-487.13 mln
jan 1, 2004
Maximum:
-69.39 mln
jan 1, 2005
At the date of observation
Value
Absolute change
Change from the previous value
jan 1, 2001
-177.8 mln
-177.8 mln
0.0%
jan 1, 2002
-118.82 mln
+58.98 mln
-33.17%
jan 1, 2003
-91.77 mln
+27.05 mln
-22.77%
jan 1, 2004
-487.13 mln
-395.36 mln
430.82%
jan 1, 2005
-69.39 mln
+417.74 mln
-85.76%
Ranking of countries by current statistics by years