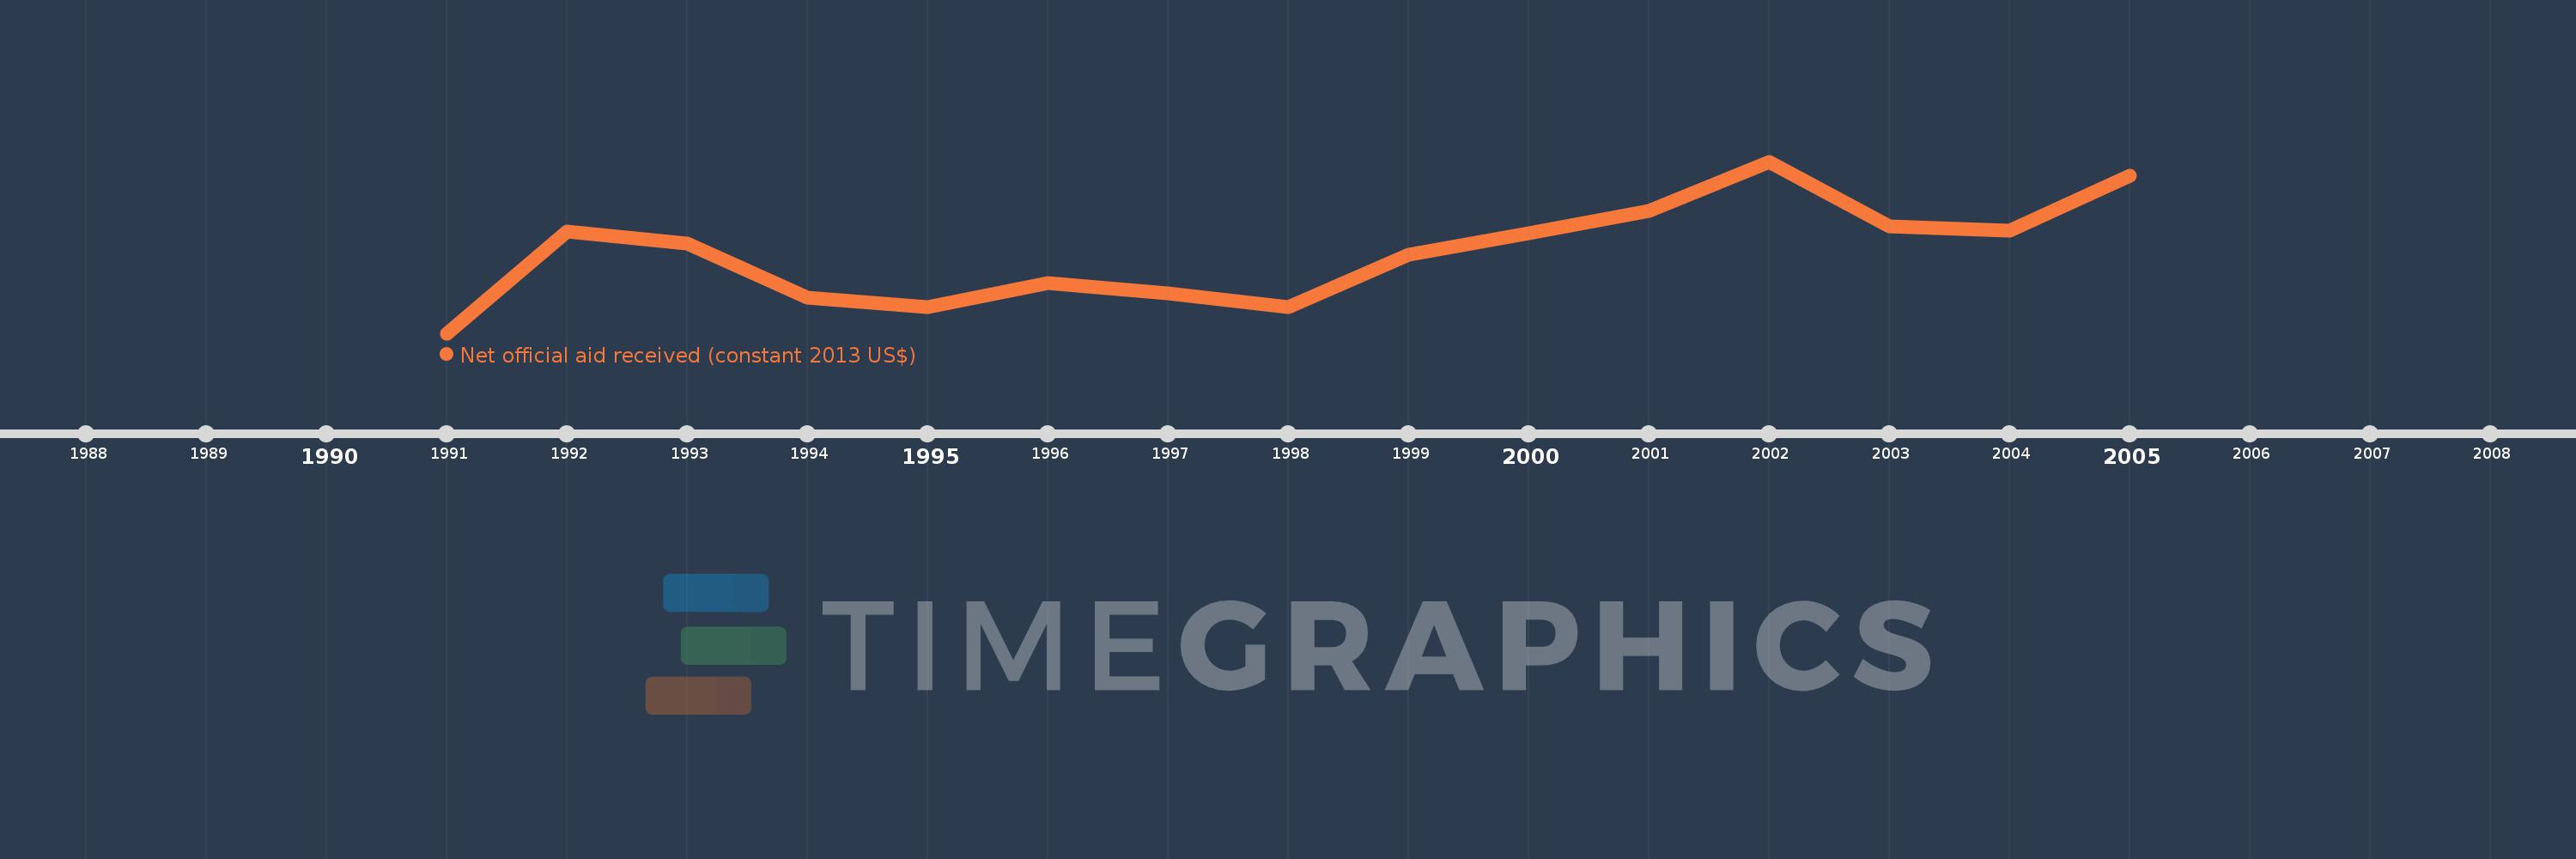
This timeline shows a graph from 1991 to 2005 of Middle income. No data until 1990. Number of actual observations by date: 15.
Source name:
World Development Indicators
Source organization:
Development Assistance Committee of the Organisation for Economic Co-operation and Development, Geographical Distribution of Financial Flows to Developing Countries, Development Co-operation Report, and International Development Statistics database. Data are available online at: www.oecd.org/dac/stats/idsonline.
Categories, topics:
Aid Effectiveness
Last updated:
apr 23, 2017
Indicators value changes by year
Meaning:
1.661 bln
Minimum:
850.72 mln
jan 1, 1991
Maximum:
2.577 bln
jan 1, 2002
At the date of observation
Value
Absolute change
Change from the previous value
jan 1, 1991
850.72 mln
+850.72 mln
0.0%
jan 1, 1992
1.87 bln
+1.019 bln
119.82%
jan 1, 1993
1.756 bln
-113.64 mln
-6.08%
jan 1, 1994
1.211 bln
-545.35 mln
-31.05%
jan 1, 1995
1.116 bln
-95.23 mln
-7.86%
jan 1, 1996
1.352 bln
+236.35 mln
21.18%
jan 1, 1997
1.25 bln
-102.02 mln
-7.55%
jan 1, 1998
1.113 bln
-137.19 mln
-10.97%
jan 1, 1999
1.642 bln
+529.29 mln
47.56%
jan 1, 2000
1.855 bln
+213.24 mln
12.98%
jan 1, 2001
2.079 bln
+223.4 mln
12.04%
jan 1, 2002
2.577 bln
+497.68 mln
23.94%
jan 1, 2003
1.925 bln
-651.2 mln
-25.27%
jan 1, 2004
1.879 bln
-46.22 mln
-2.4%
jan 1, 2005
2.433 bln
+554.11 mln
29.49%
Ranking of countries by current statistics by years