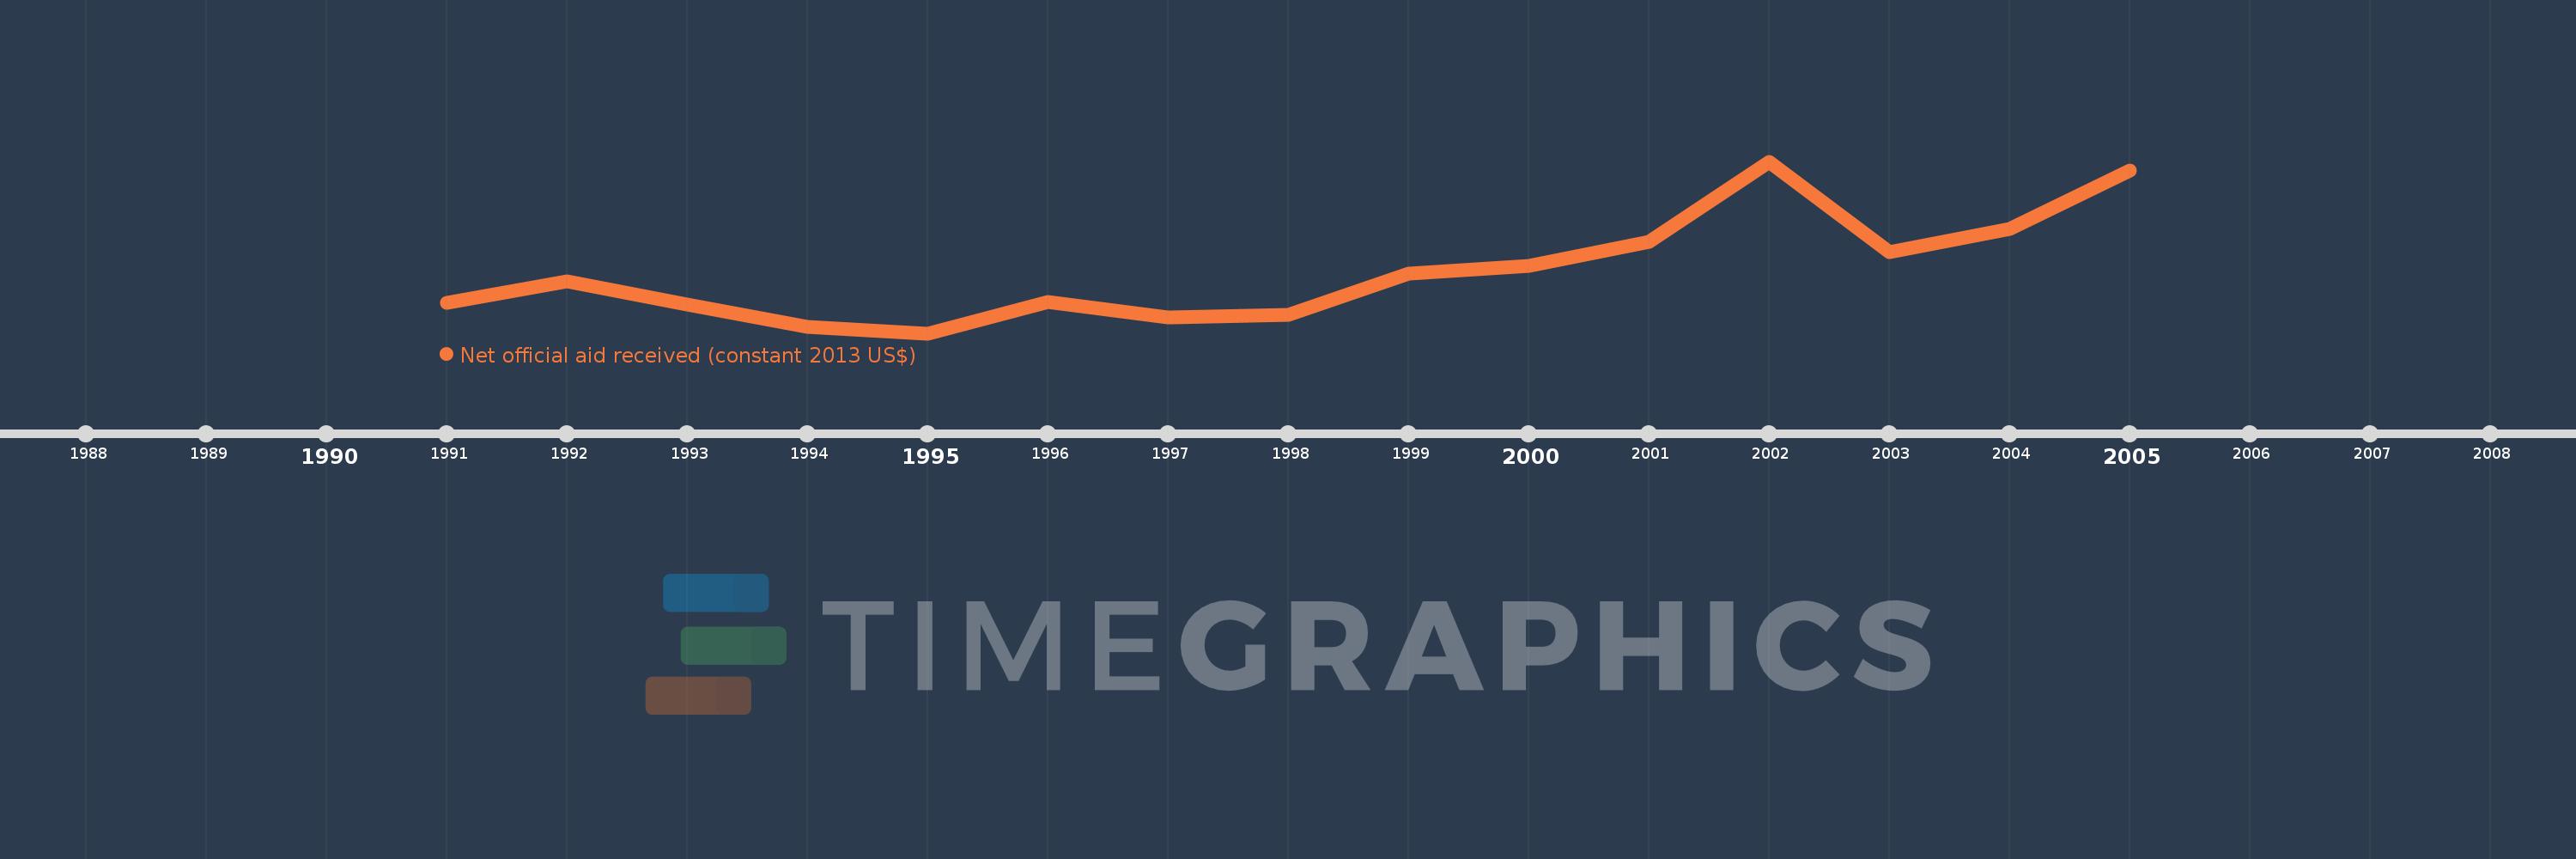
This timeline shows a graph from 1991 to 2005 of Romania. No data until 1990. Number of actual observations by date: 15.
Source name:
World Development Indicators
Source organization:
Development Assistance Committee of the Organisation for Economic Co-operation and Development, Geographical Distribution of Financial Flows to Developing Countries, Development Co-operation Report, and International Development Statistics database. Data are available online at: www.oecd.org/dac/stats/idsonline.
Categories, topics:
Aid Effectiveness
Last updated:
apr 23, 2017
Indicators value changes by year
Meaning:
559.557 mln
Minimum:
225.23 mln
jan 1, 1995
Maximum:
1.161 bln
jan 1, 2002
At the date of observation
Value
Absolute change
Change from the previous value
jan 1, 1991
391.58 mln
+391.58 mln
0.0%
jan 1, 1992
506.89 mln
+115.31 mln
29.45%
jan 1, 1993
383.3 mln
-123.59 mln
-24.38%
jan 1, 1994
259.64 mln
-123.66 mln
-32.26%
jan 1, 1995
225.23 mln
-34.41 mln
-13.25%
jan 1, 1996
394.82 mln
+169.59 mln
75.3%
jan 1, 1997
310.44 mln
-84.38 mln
-21.37%
jan 1, 1998
325.5 mln
+15.06 mln
4.85%
jan 1, 1999
549.24 mln
+223.74 mln
68.74%
jan 1, 2000
591.91 mln
+42.67 mln
7.77%
jan 1, 2001
724.1 mln
+132.19 mln
22.33%
jan 1, 2002
1.161 bln
+436.42 mln
60.27%
jan 1, 2003
665.15 mln
-495.37 mln
-42.69%
jan 1, 2004
792.16 mln
+127.01 mln
19.09%
jan 1, 2005
1.113 bln
+320.71 mln
40.49%
Ranking of countries by current statistics by years