Download This statistics in other country:
Timeline:
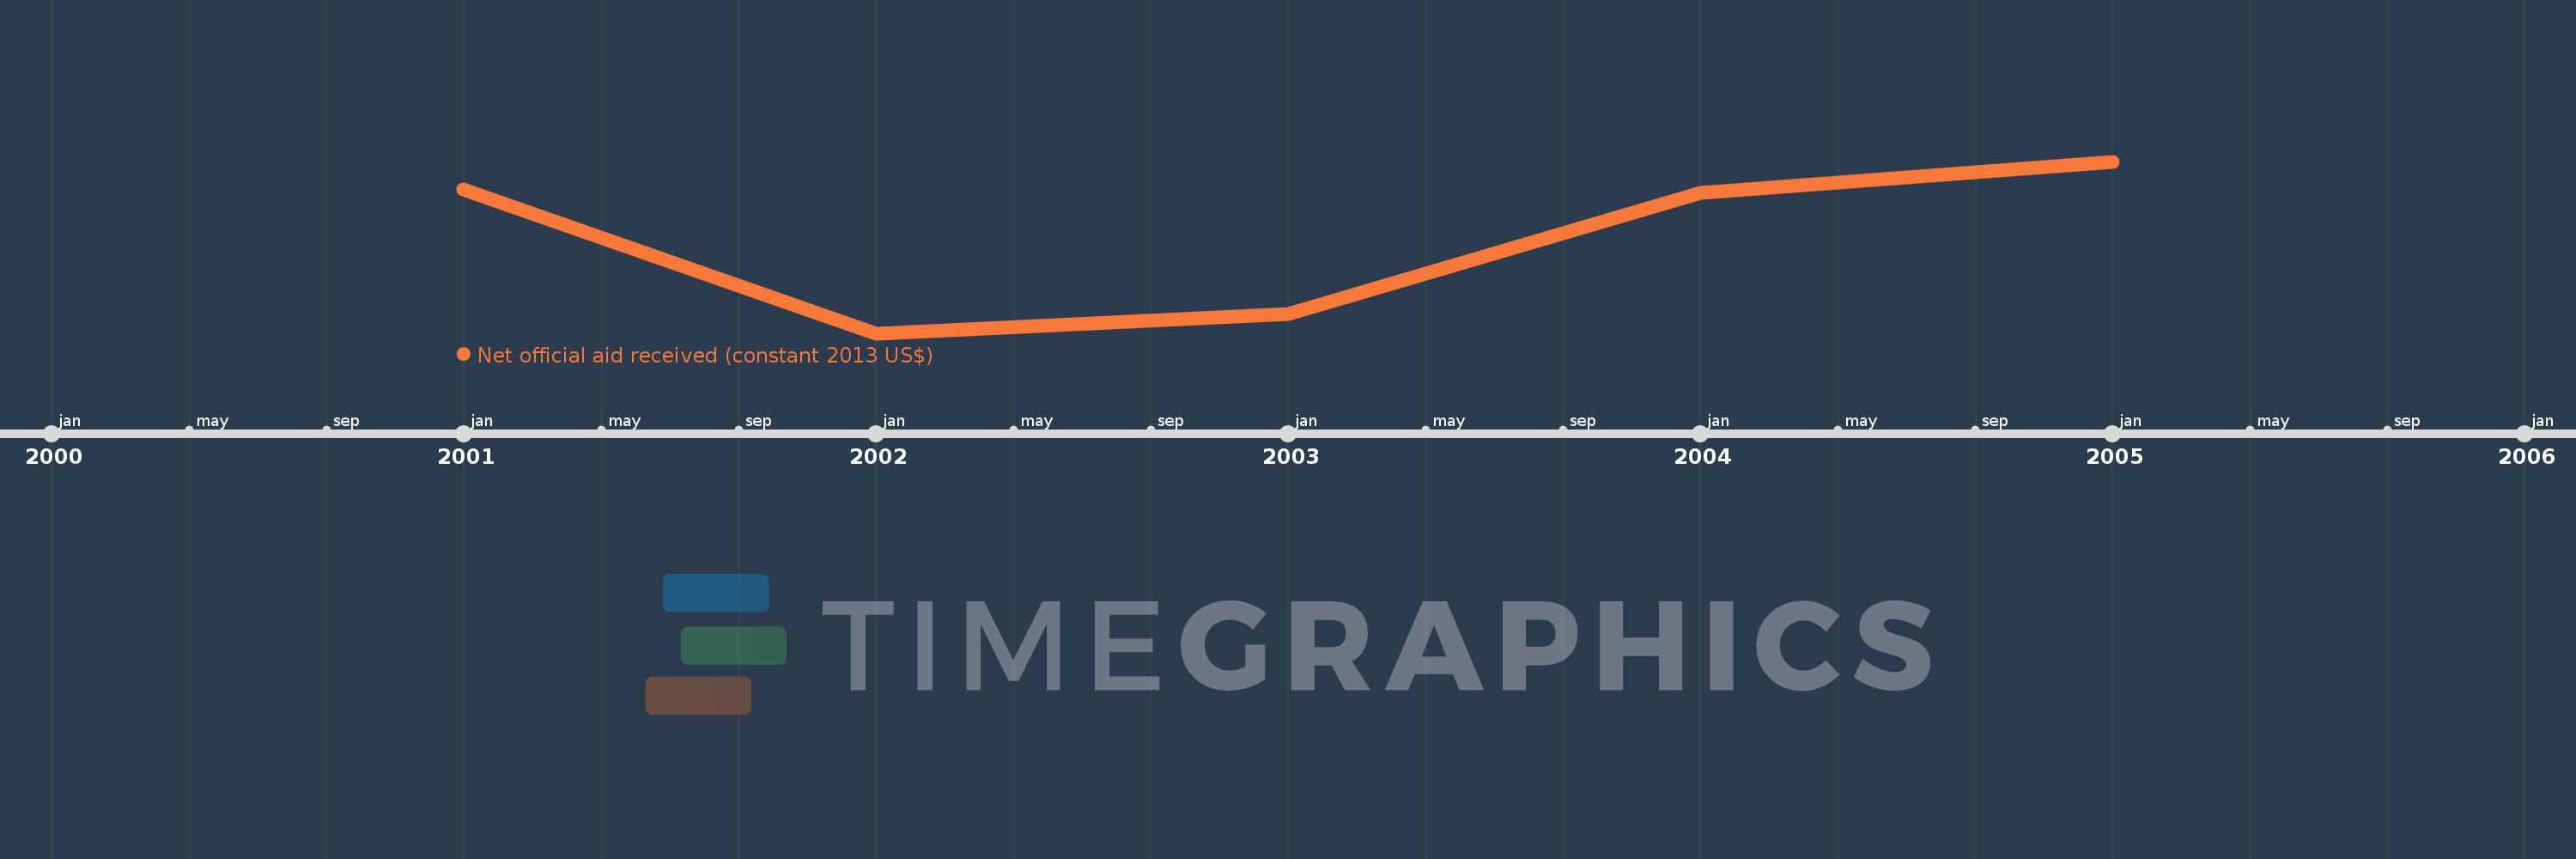
This timeline shows a graph from 2001 to 2005 of New Caledonia. No data until 2000. Number of actual observations by date: 5.
Source name:
World Development Indicators
Source organization:
Development Assistance Committee of the Organisation for Economic Co-operation and Development, Geographical Distribution of Financial Flows to Developing Countries, Development Co-operation Report, and International Development Statistics database. Data are available online at: www.oecd.org/dac/stats/idsonline.
Categories, topics:
Aid Effectiveness
Last updated:
apr 23, 2017
Indicators value changes by year
Minimum:
525.44 mln
jan 1, 2002
Maximum:
638.58 mln
jan 1, 2005
At the date of observation
Value
Absolute change
Change from the previous value
jan 1, 2001
620.21 mln
+620.21 mln
0.0%
jan 1, 2002
525.44 mln
-94.77 mln
-15.28%
jan 1, 2003
538.45 mln
+13.01 mln
2.48%
jan 1, 2004
618.16 mln
+79.71 mln
14.8%
jan 1, 2005
638.58 mln
+20.42 mln
3.3%
Ranking of countries by current statistics by years