Download This statistics in other country:
Timeline:
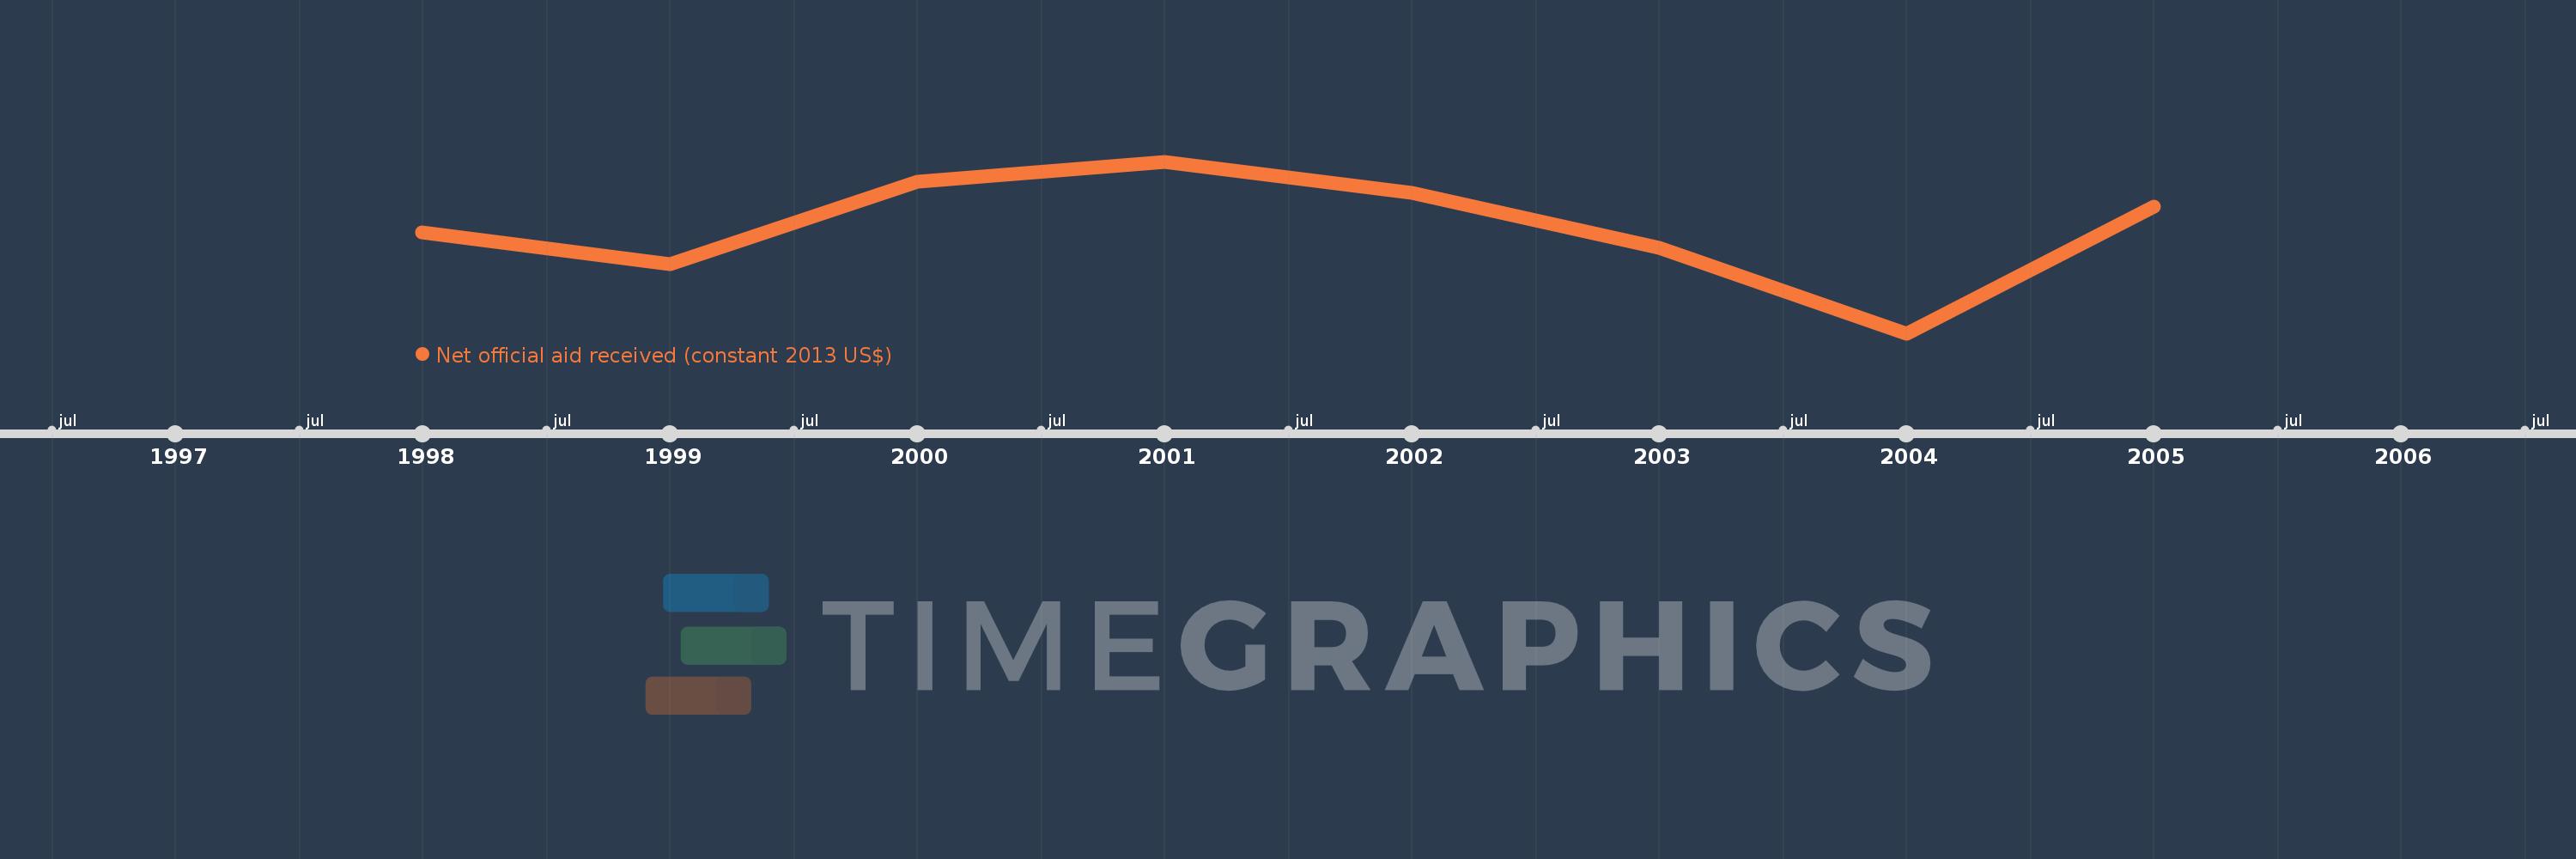
This timeline shows a graph from 1998 to 2005 of Cyprus. No data until 1997. Number of actual observations by date: 8.
Source name:
World Development Indicators
Source organization:
Development Assistance Committee of the Organisation for Economic Co-operation and Development, Geographical Distribution of Financial Flows to Developing Countries, Development Co-operation Report, and International Development Statistics database. Data are available online at: www.oecd.org/dac/stats/idsonline.
Categories, topics:
Aid Effectiveness
Last updated:
apr 23, 2017
Indicators value changes by year
Minimum:
19.98 mln
jan 1, 2004
Maximum:
95.84 mln
jan 1, 2001
At the date of observation
Value
Absolute change
Change from the previous value
jan 1, 1998
64.55 mln
+64.55 mln
0.0%
jan 1, 1999
50.6 mln
-13.95 mln
-21.61%
jan 1, 2000
86.98 mln
+36.38 mln
71.9%
jan 1, 2001
95.84 mln
+8.86 mln
10.19%
jan 1, 2002
82.1 mln
-13.74 mln
-14.34%
jan 1, 2003
57.86 mln
-24.24 mln
-29.52%
jan 1, 2004
19.98 mln
-37.88 mln
-65.47%
jan 1, 2005
75.91 mln
+55.93 mln
279.93%
Ranking of countries by current statistics by years