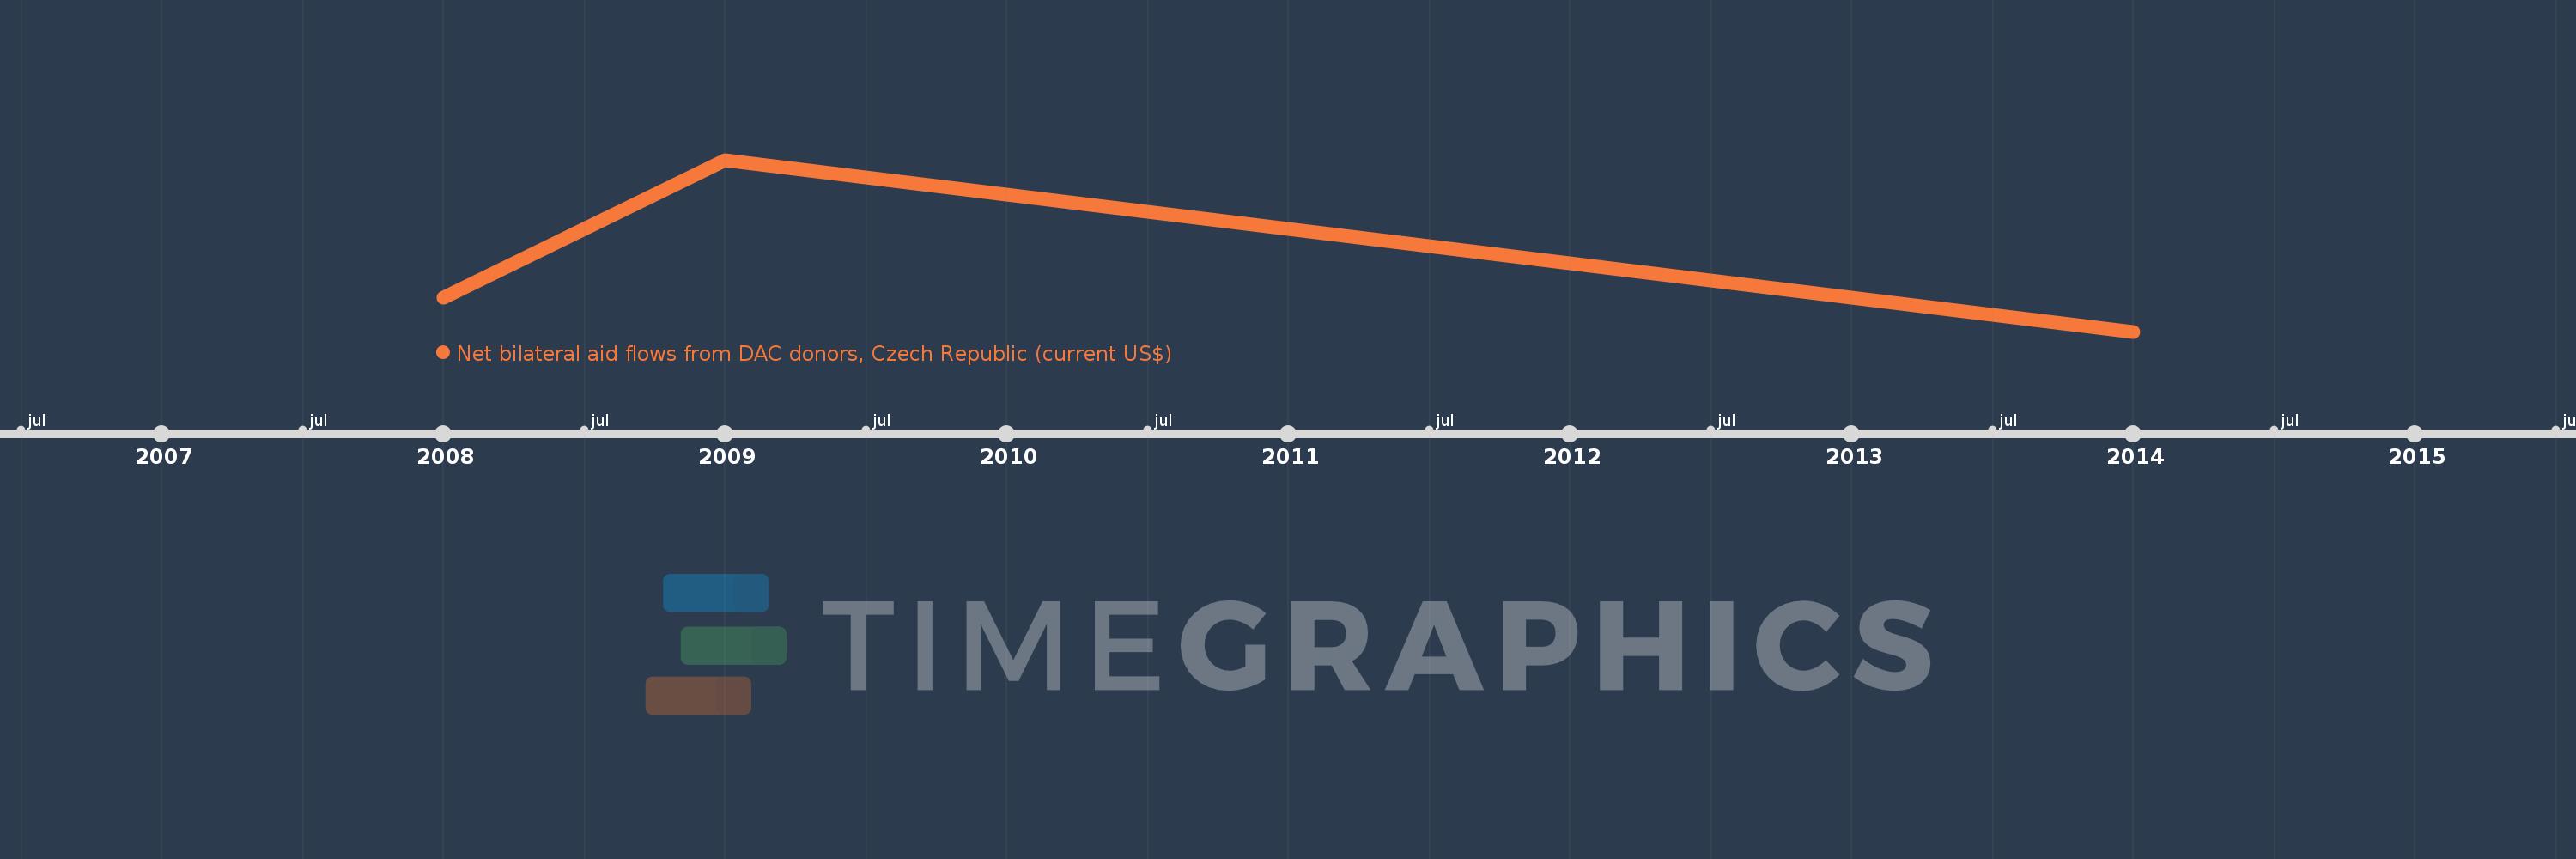
This timeline shows a graph from 2008 to 2014 of Pacific island small states. No data until 2007. Number of actual observations by date: 3.
Source name:
World Development Indicators
Source organization:
Development Assistance Committee of the Organisation for Economic Co-operation and Development, Geographical Distribution of Financial Flows to Developing Countries, Development Co-operation
Categories, topics:
Aid Effectiveness
Last updated:
apr 23, 2017
Indicators value changes by year
Meaning:
30.0K
Minimum:
10.0K
jan 1, 2014
Maximum:
60.0K
jan 1, 2009
At the date of observation
Value
Absolute change
Change from the previous value
jan 1, 2008
20.0K
+20.0K
0.0%
jan 1, 2009
60.0K
+40.0K
200.0%
jan 1, 2014
10.0K
-50.0K
-83.33%
Ranking of countries by current statistics by years