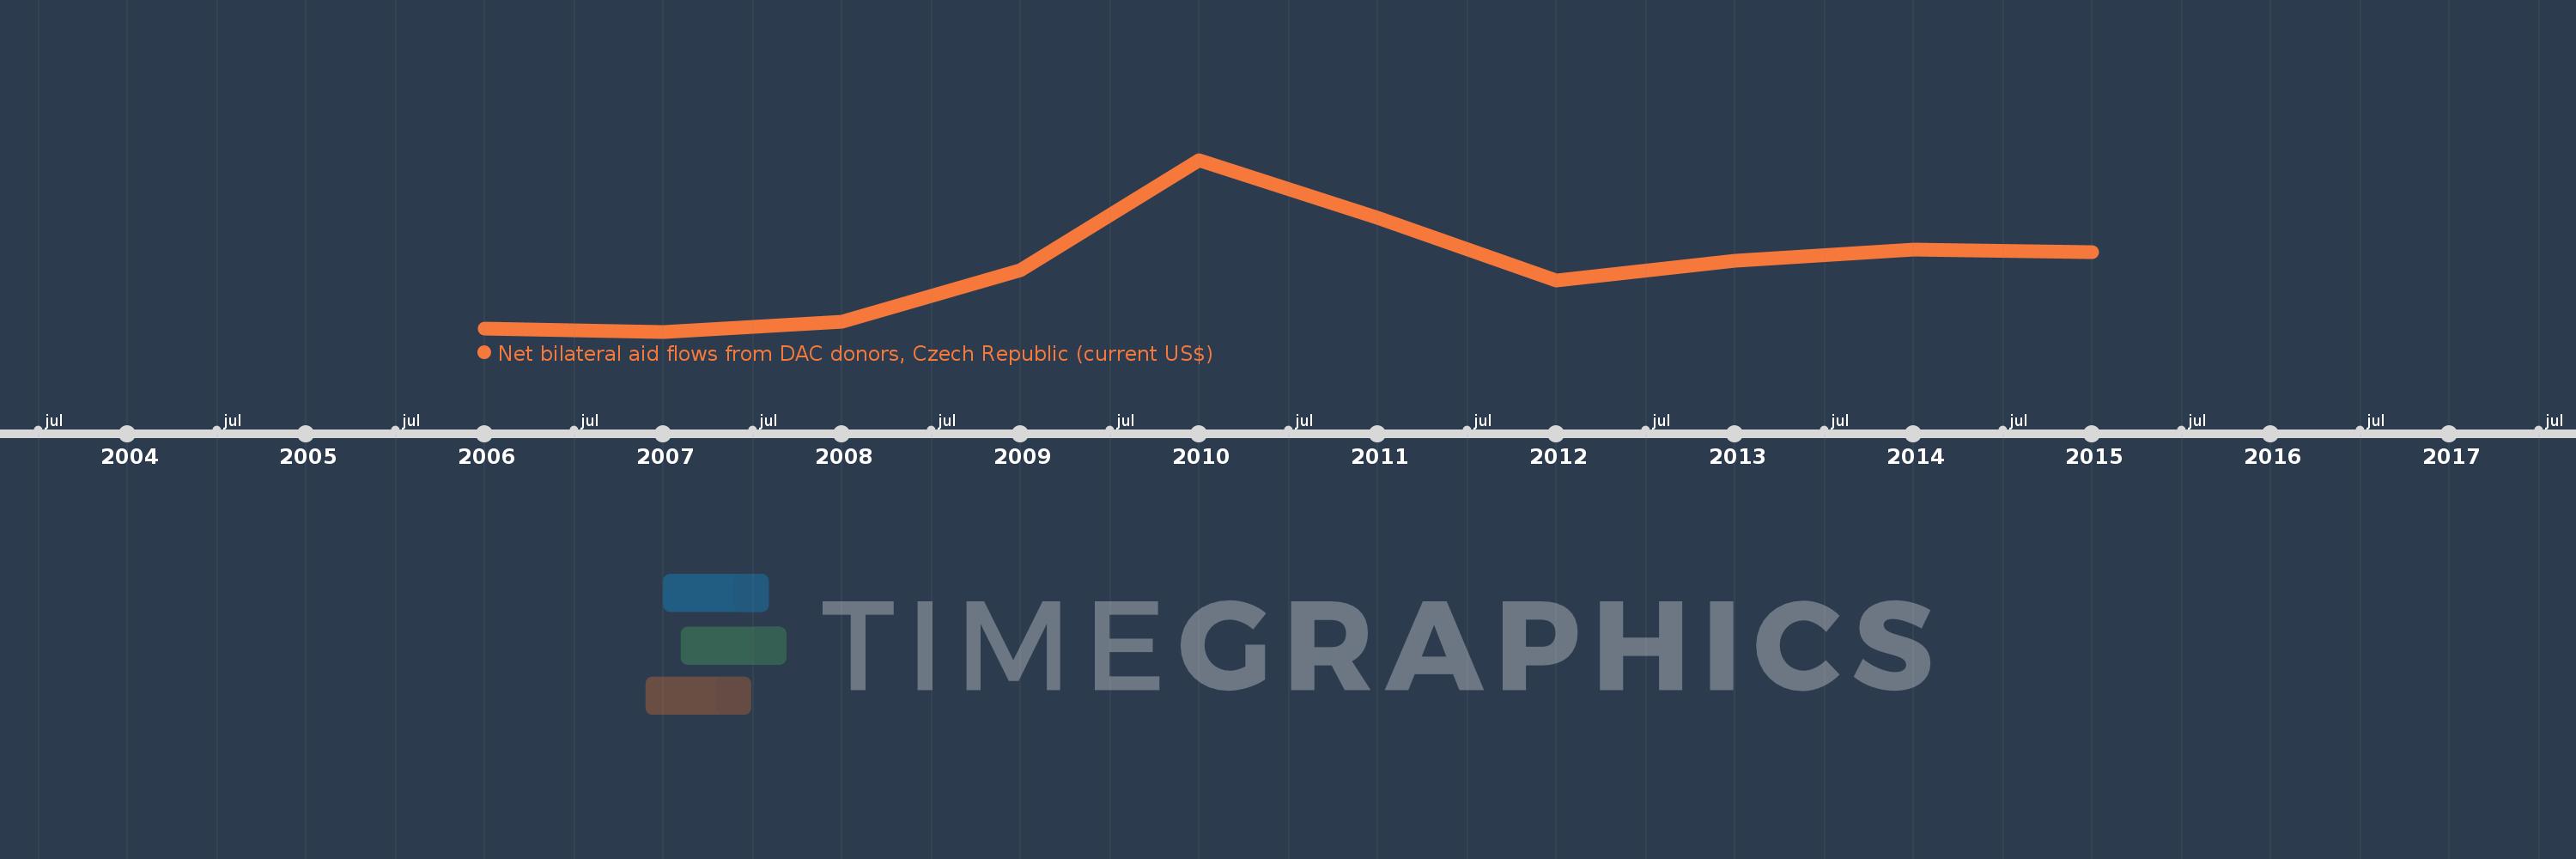
This timeline shows a graph from 2006 to 2015 of Georgia. No data until 2005. Number of actual observations by date: 10.
Source name:
World Development Indicators
Source organization:
Development Assistance Committee of the Organisation for Economic Co-operation and Development, Geographical Distribution of Financial Flows to Developing Countries, Development Co-operation
Categories, topics:
Aid Effectiveness
Last updated:
apr 23, 2017
Indicators value changes by year
Meaning:
2.44 mln
Minimum:
560.0K
jan 1, 2007
Maximum:
5.57 mln
jan 1, 2010
At the date of observation
Value
Absolute change
Change from the previous value
jan 1, 2006
660.0K
+660.0K
0.0%
jan 1, 2007
560.0K
-100.0K
-15.15%
jan 1, 2008
850.0K
+290.0K
51.79%
jan 1, 2009
2.36 mln
+1.51 mln
177.65%
jan 1, 2010
5.57 mln
+3.21 mln
136.02%
jan 1, 2011
3.89 mln
-1.68 mln
-30.16%
jan 1, 2012
2.05 mln
-1.84 mln
-47.3%
jan 1, 2013
2.63 mln
+580.0K
28.29%
jan 1, 2014
2.95 mln
+320.0K
12.17%
jan 1, 2015
2.88 mln
-70.0K
-2.37%
Ranking of countries by current statistics by years