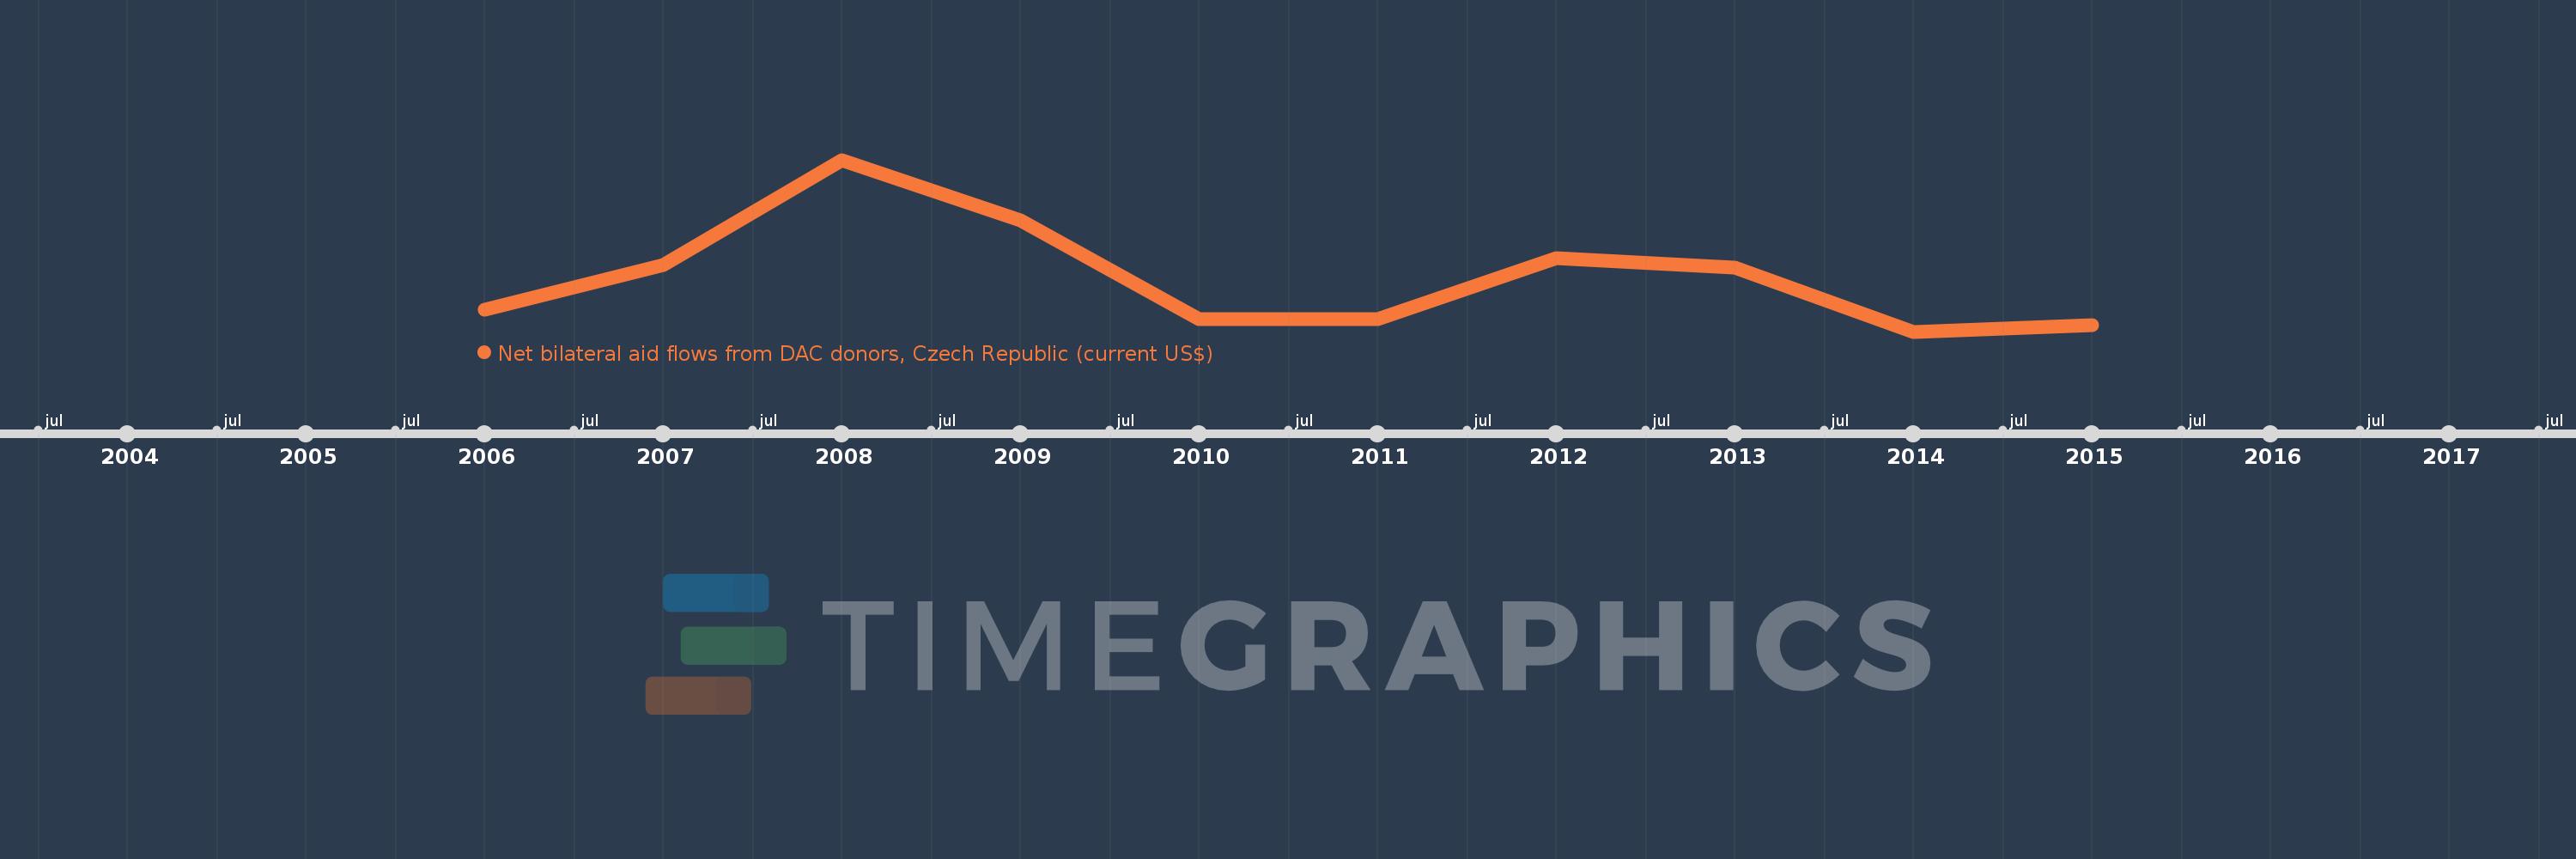
This timeline shows a graph from 2006 to 2015 of Sudan. No data until 2005. Number of actual observations by date: 10.
Source name:
World Development Indicators
Source organization:
Development Assistance Committee of the Organisation for Economic Co-operation and Development, Geographical Distribution of Financial Flows to Developing Countries, Development Co-operation
Categories, topics:
Aid Effectiveness
Last updated:
apr 23, 2017
Indicators value changes by year
Meaning:
190.0K
Minimum:
20.0K
jan 1, 2014
Maximum:
560.0K
jan 1, 2008
At the date of observation
Value
Absolute change
Change from the previous value
jan 1, 2006
90.0K
+90.0K
0.0%
jan 1, 2007
230.0K
+140.0K
155.56%
jan 1, 2008
560.0K
+330.0K
143.48%
jan 1, 2009
370.0K
-190.0K
-33.93%
jan 1, 2010
60.0K
-310.0K
-83.78%
jan 1, 2011
60.0K
0.0
0.0%
jan 1, 2012
250.0K
+190.0K
316.67%
jan 1, 2013
220.0K
-30.0K
-12.0%
jan 1, 2014
20.0K
-200.0K
-90.91%
jan 1, 2015
40.0K
+20.0K
100.0%
Ranking of countries by current statistics by years