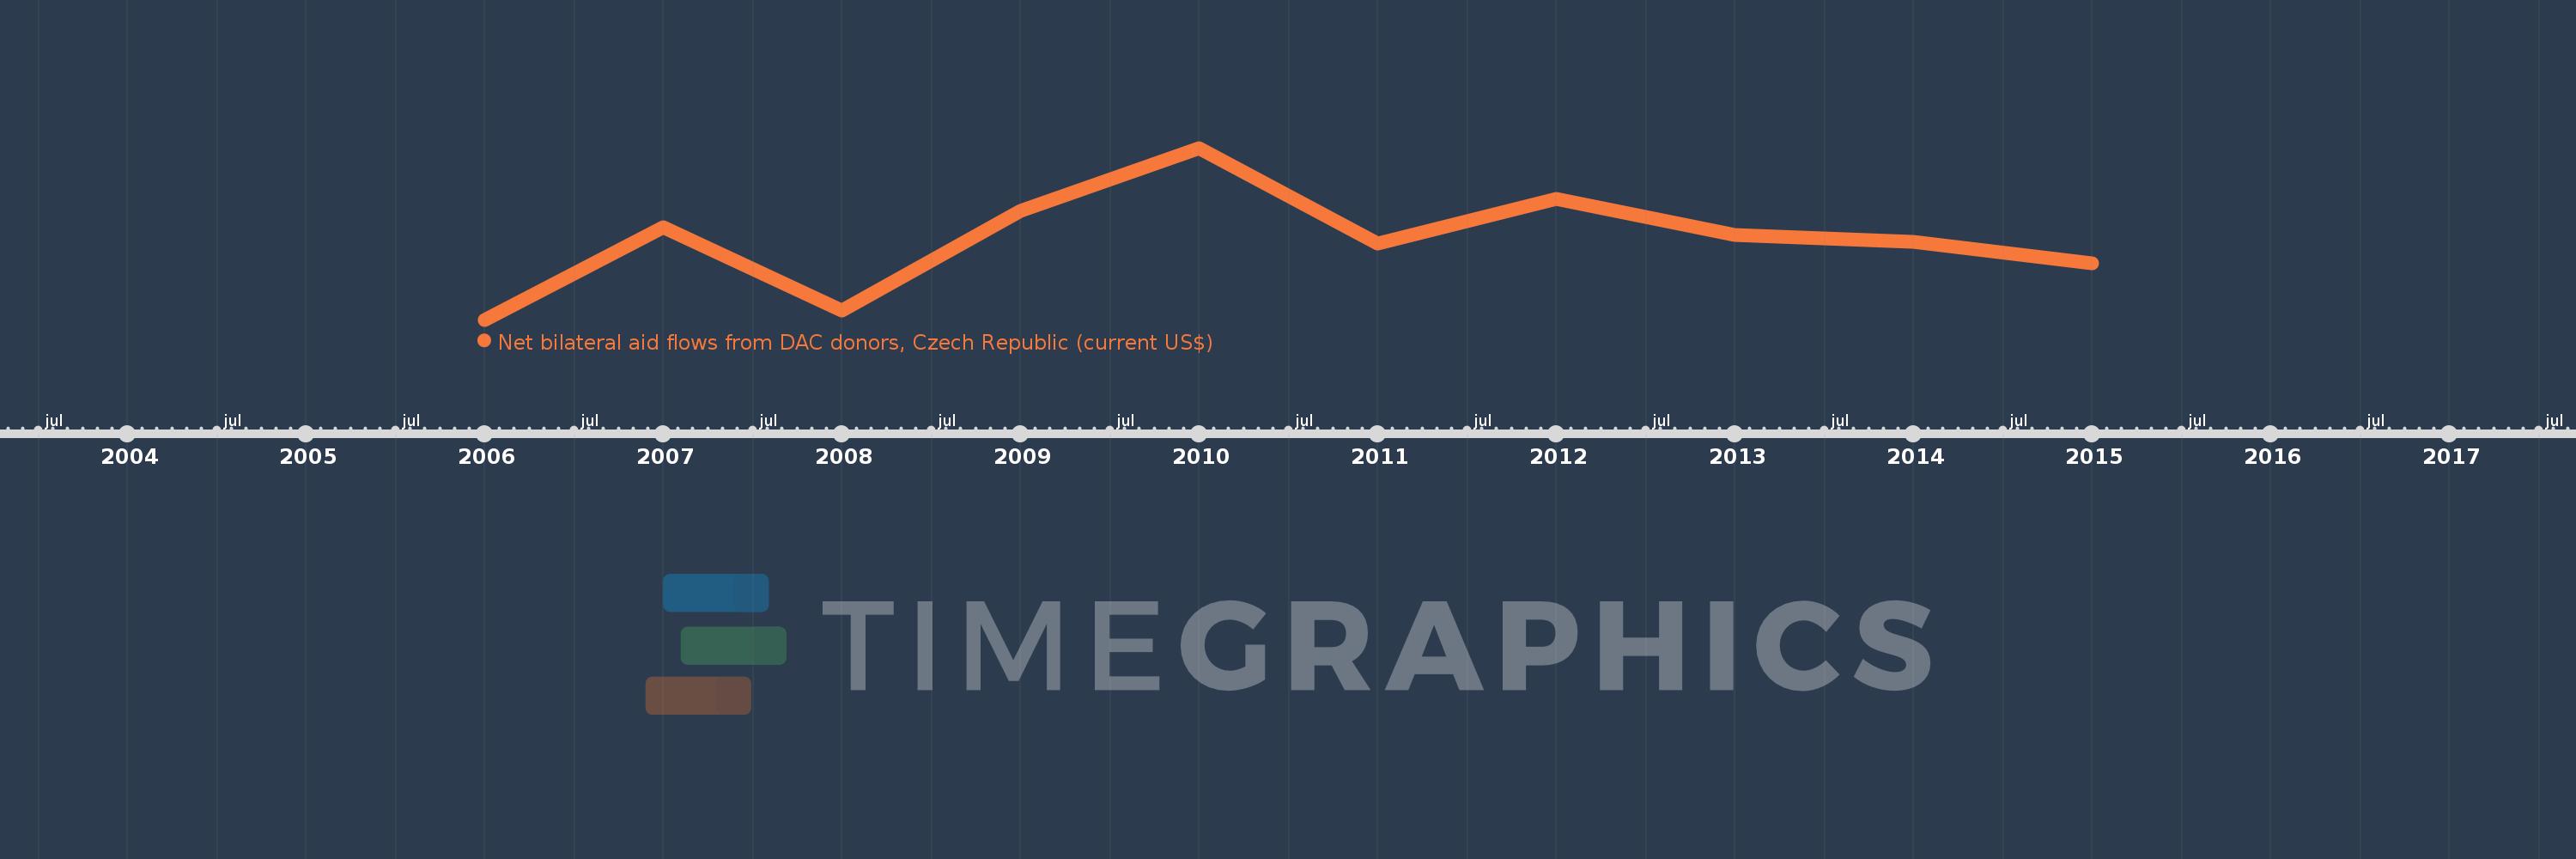
This timeline shows a graph from 2006 to 2015 of Zambia. No data until 2005. Number of actual observations by date: 10.
Source name:
World Development Indicators
Source organization:
Development Assistance Committee of the Organisation for Economic Co-operation and Development, Geographical Distribution of Financial Flows to Developing Countries, Development Co-operation
Categories, topics:
Aid Effectiveness
Last updated:
apr 23, 2017
Indicators value changes by year
Meaning:
801.0K
Minimum:
360.0K
jan 1, 2006
Maximum:
1.31 mln
jan 1, 2010
At the date of observation
Value
Absolute change
Change from the previous value
jan 1, 2006
360.0K
+360.0K
0.0%
jan 1, 2007
870.0K
+510.0K
141.67%
jan 1, 2008
410.0K
-460.0K
-52.87%
jan 1, 2009
960.0K
+550.0K
134.15%
jan 1, 2010
1.31 mln
+350.0K
36.46%
jan 1, 2011
780.0K
-530.0K
-40.46%
jan 1, 2012
1.03 mln
+250.0K
32.05%
jan 1, 2013
830.0K
-200.0K
-19.42%
jan 1, 2014
790.0K
-40.0K
-4.82%
jan 1, 2015
670.0K
-120.0K
-15.19%
Ranking of countries by current statistics by years