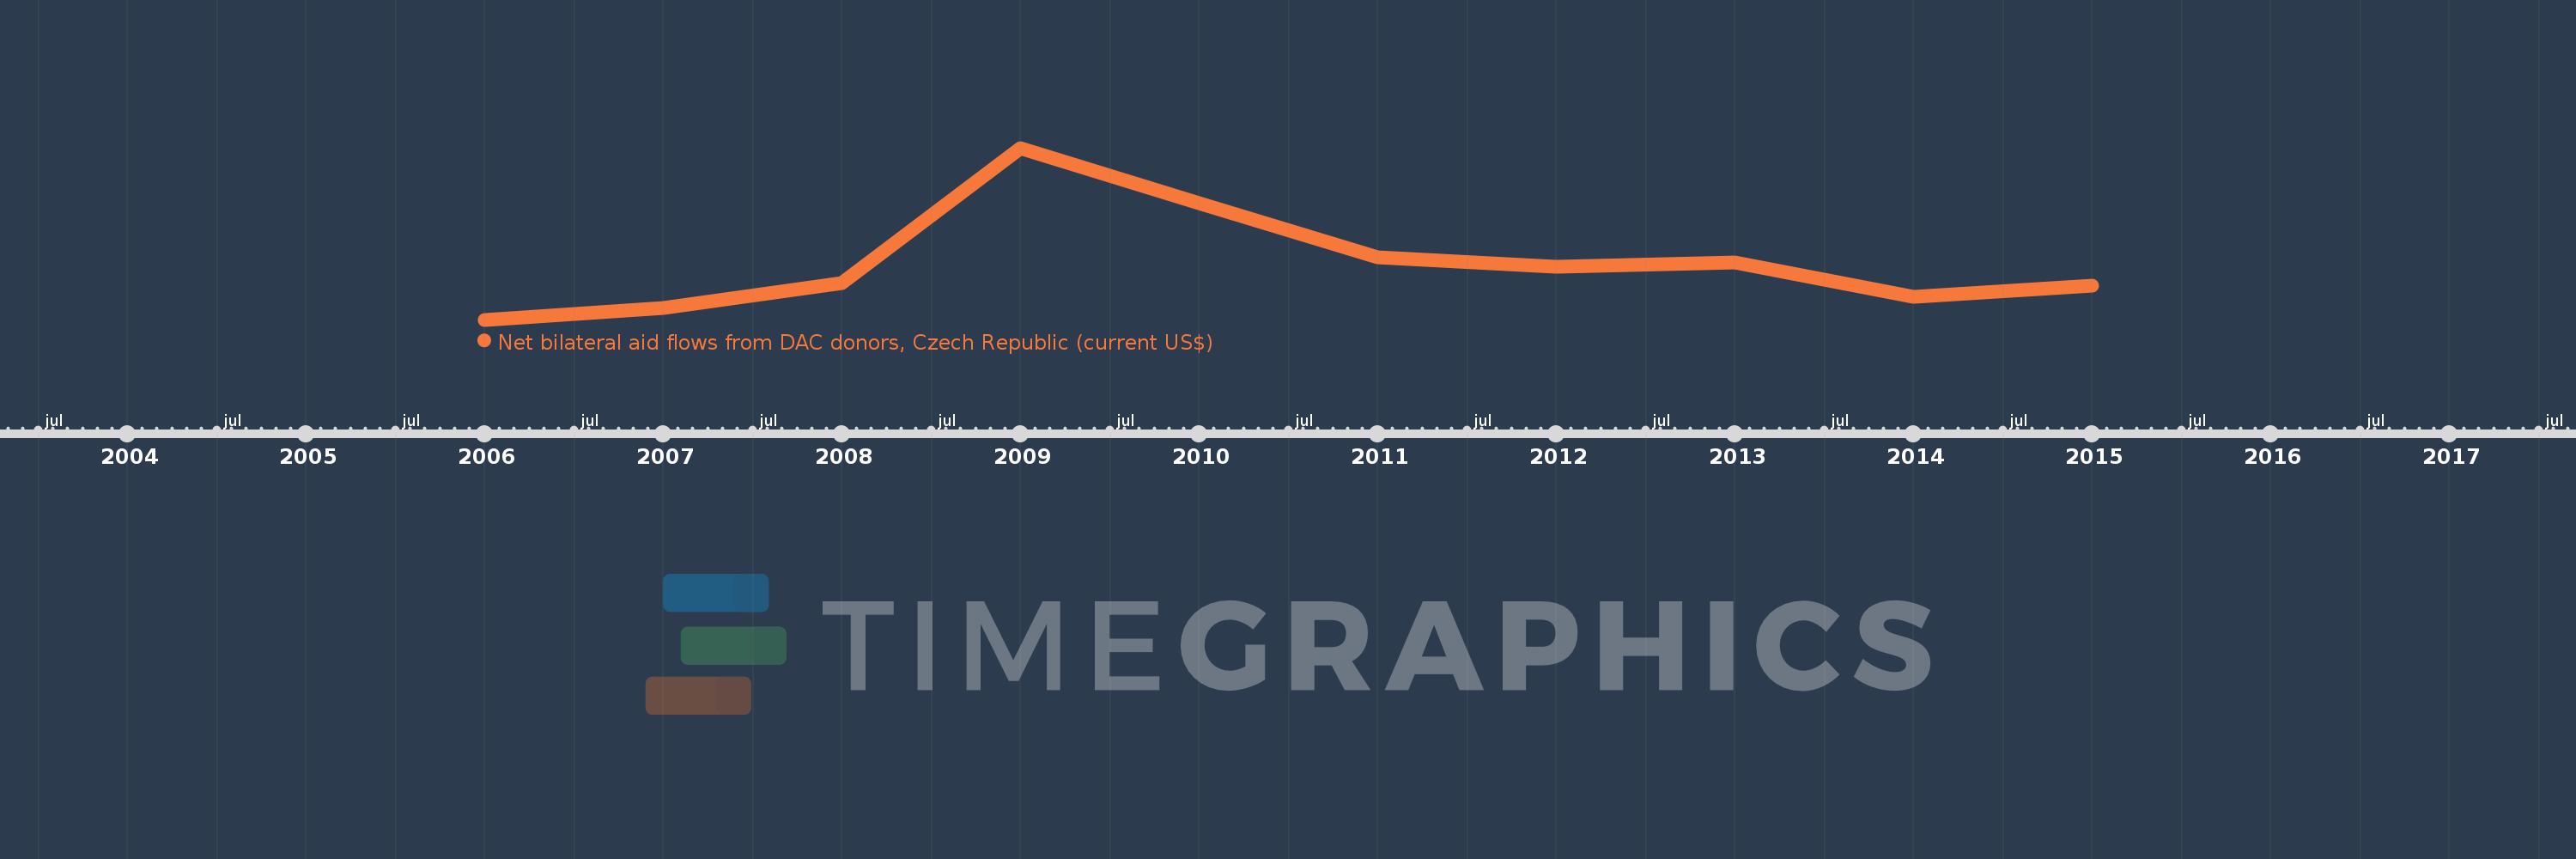
This timeline shows a graph from 2006 to 2015 of Low income. No data until 2005. Number of actual observations by date: 10.
Source name:
World Development Indicators
Source organization:
Development Assistance Committee of the Organisation for Economic Co-operation and Development, Geographical Distribution of Financial Flows to Developing Countries, Development Co-operation
Categories, topics:
Aid Effectiveness
Last updated:
apr 23, 2017
Indicators value changes by year
Meaning:
18.215 mln
Minimum:
4.06 mln
jan 1, 2006
Maximum:
46.9 mln
jan 1, 2009
At the date of observation
Value
Absolute change
Change from the previous value
jan 1, 2006
4.06 mln
+4.06 mln
0.0%
jan 1, 2007
7.02 mln
+2.96 mln
72.91%
jan 1, 2008
13.31 mln
+6.29 mln
89.6%
jan 1, 2009
46.9 mln
+33.59 mln
252.37%
jan 1, 2010
33.21 mln
-13.69 mln
-29.19%
jan 1, 2011
19.64 mln
-13.57 mln
-40.86%
jan 1, 2012
17.26 mln
-2.38 mln
-12.12%
jan 1, 2013
18.41 mln
+1.15 mln
6.66%
jan 1, 2014
9.77 mln
-8.64 mln
-46.93%
jan 1, 2015
12.57 mln
+2.8 mln
28.66%
Ranking of countries by current statistics by years