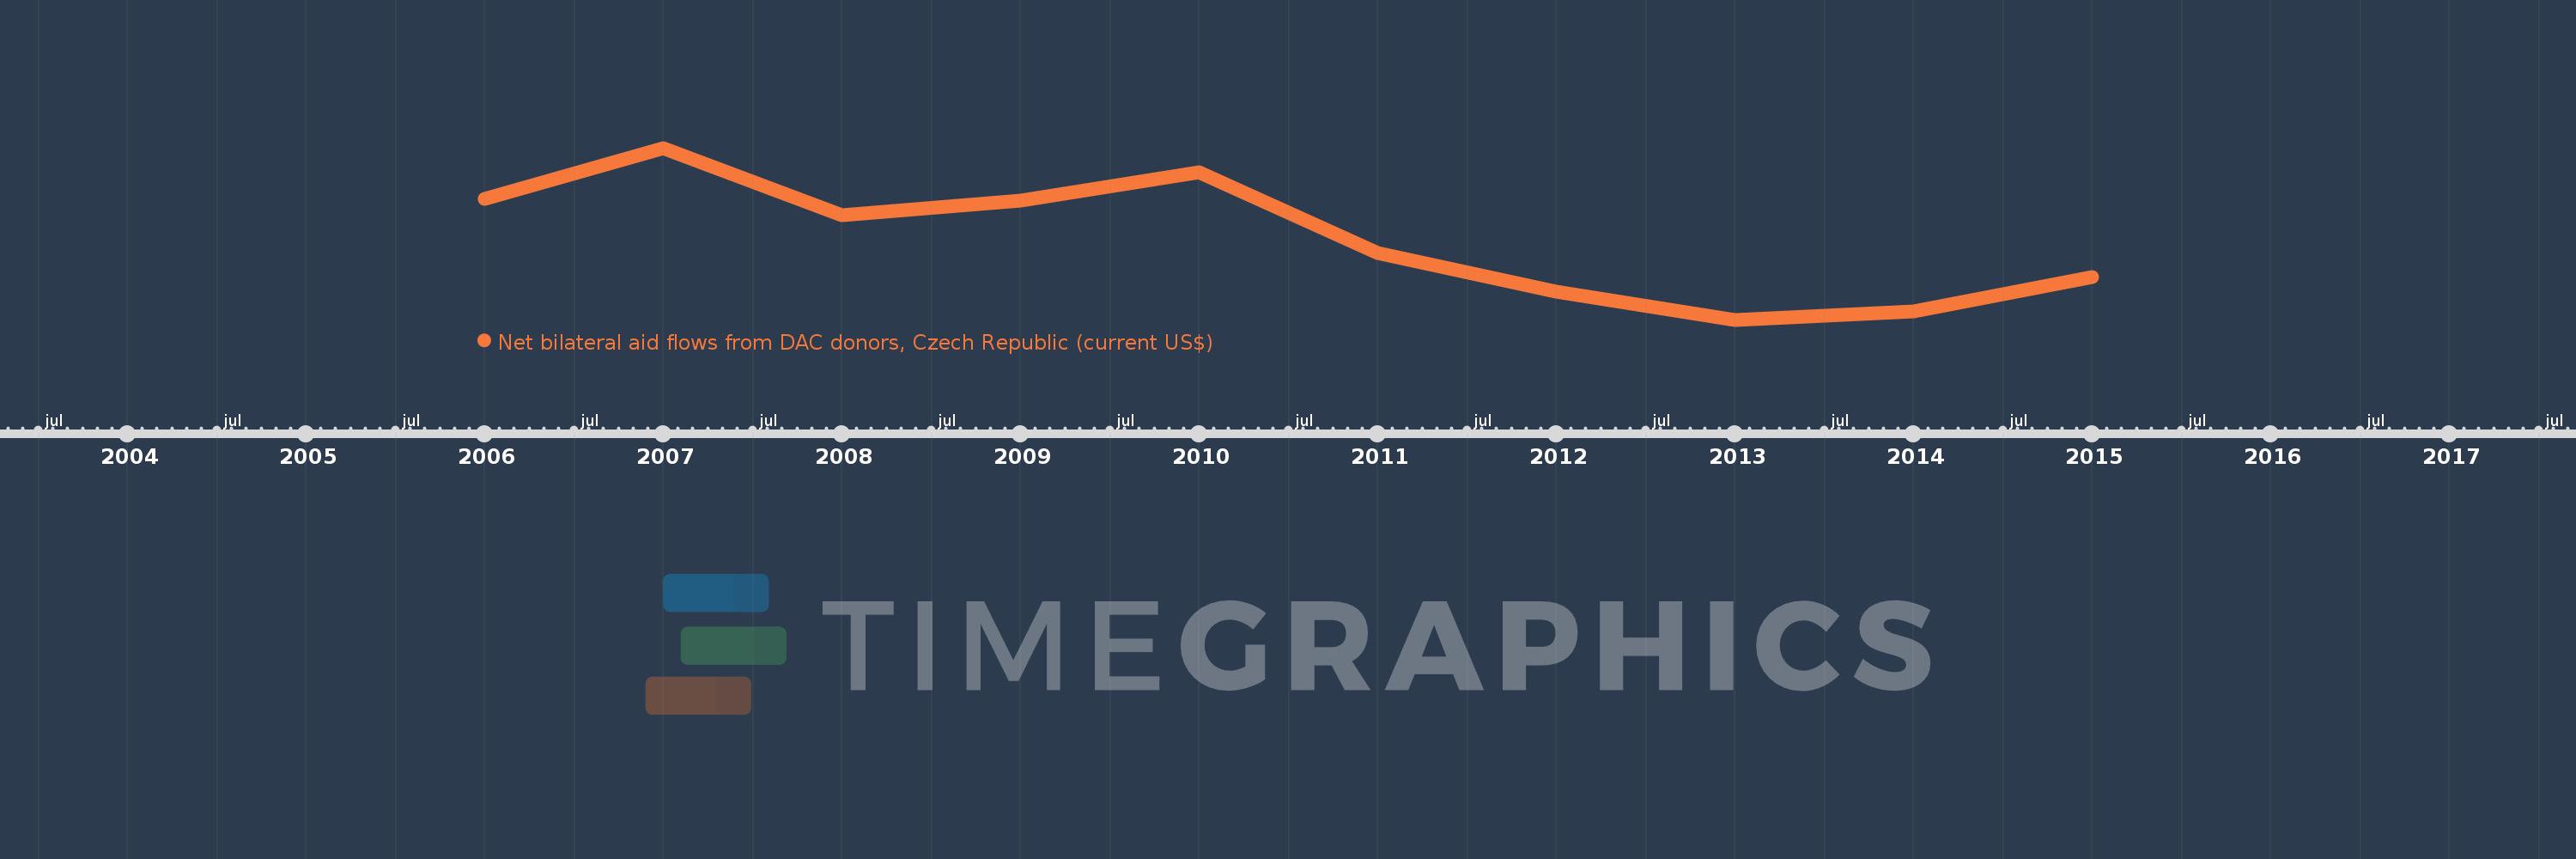
This timeline shows a graph from 2006 to 2015 of IBRD only. No data until 2005. Number of actual observations by date: 10.
Source name:
World Development Indicators
Source organization:
Development Assistance Committee of the Organisation for Economic Co-operation and Development, Geographical Distribution of Financial Flows to Developing Countries, Development Co-operation
Categories, topics:
Aid Effectiveness
Last updated:
apr 23, 2017
Indicators value changes by year
Meaning:
27.404 mln
Minimum:
17.82 mln
jan 1, 2013
Maximum:
38.15 mln
jan 1, 2007
At the date of observation
Value
Absolute change
Change from the previous value
jan 1, 2006
32.1 mln
+32.1 mln
0.0%
jan 1, 2007
38.15 mln
+6.05 mln
18.85%
jan 1, 2008
30.24 mln
-7.91 mln
-20.73%
jan 1, 2009
31.93 mln
+1.69 mln
5.59%
jan 1, 2010
35.27 mln
+3.34 mln
10.46%
jan 1, 2011
25.74 mln
-9.53 mln
-27.02%
jan 1, 2012
21.12 mln
-4.62 mln
-17.95%
jan 1, 2013
17.82 mln
-3.3 mln
-15.63%
jan 1, 2014
18.83 mln
+1.01 mln
5.67%
jan 1, 2015
22.84 mln
+4.01 mln
21.3%
Ranking of countries by current statistics by years