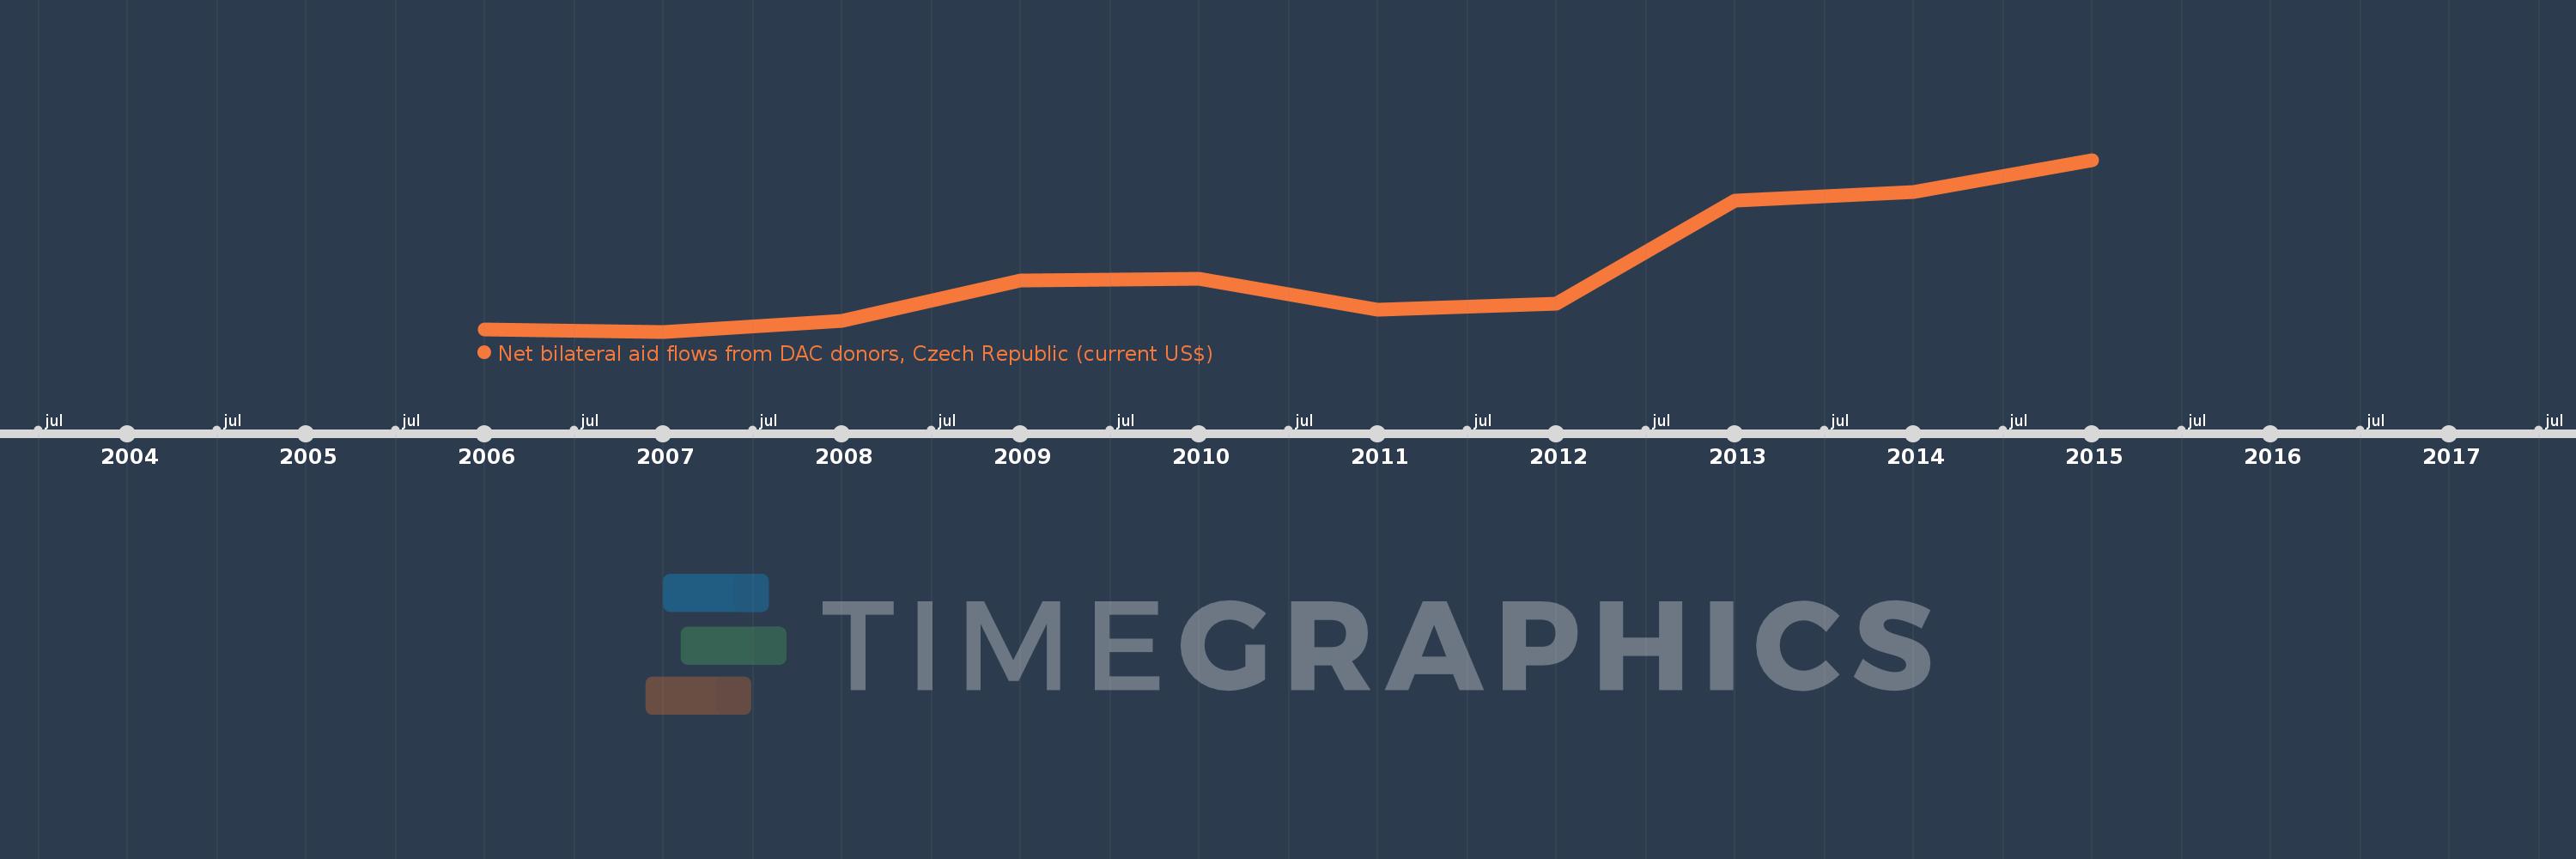
This timeline shows a graph from 2006 to 2015 of Syrian Arab Republic. No data until 2005. Number of actual observations by date: 10.
Source name:
World Development Indicators
Source organization:
Development Assistance Committee of the Organisation for Economic Co-operation and Development, Geographical Distribution of Financial Flows to Developing Countries, Development Co-operation
Categories, topics:
Aid Effectiveness
Last updated:
apr 23, 2017
Indicators value changes by year
Meaning:
697.0K
Minimum:
60.0K
jan 1, 2007
Maximum:
1.86 mln
jan 1, 2015
At the date of observation
Value
Absolute change
Change from the previous value
jan 1, 2006
80.0K
+80.0K
0.0%
jan 1, 2007
60.0K
-20.0K
-25.0%
jan 1, 2008
170.0K
+110.0K
183.33%
jan 1, 2009
600.0K
+430.0K
252.94%
jan 1, 2010
610.0K
+10.0K
1.67%
jan 1, 2011
290.0K
-320.0K
-52.46%
jan 1, 2012
350.0K
+60.0K
20.69%
jan 1, 2013
1.43 mln
+1.08 mln
308.57%
jan 1, 2014
1.52 mln
+90.0K
6.29%
jan 1, 2015
1.86 mln
+340.0K
22.37%
Ranking of countries by current statistics by years