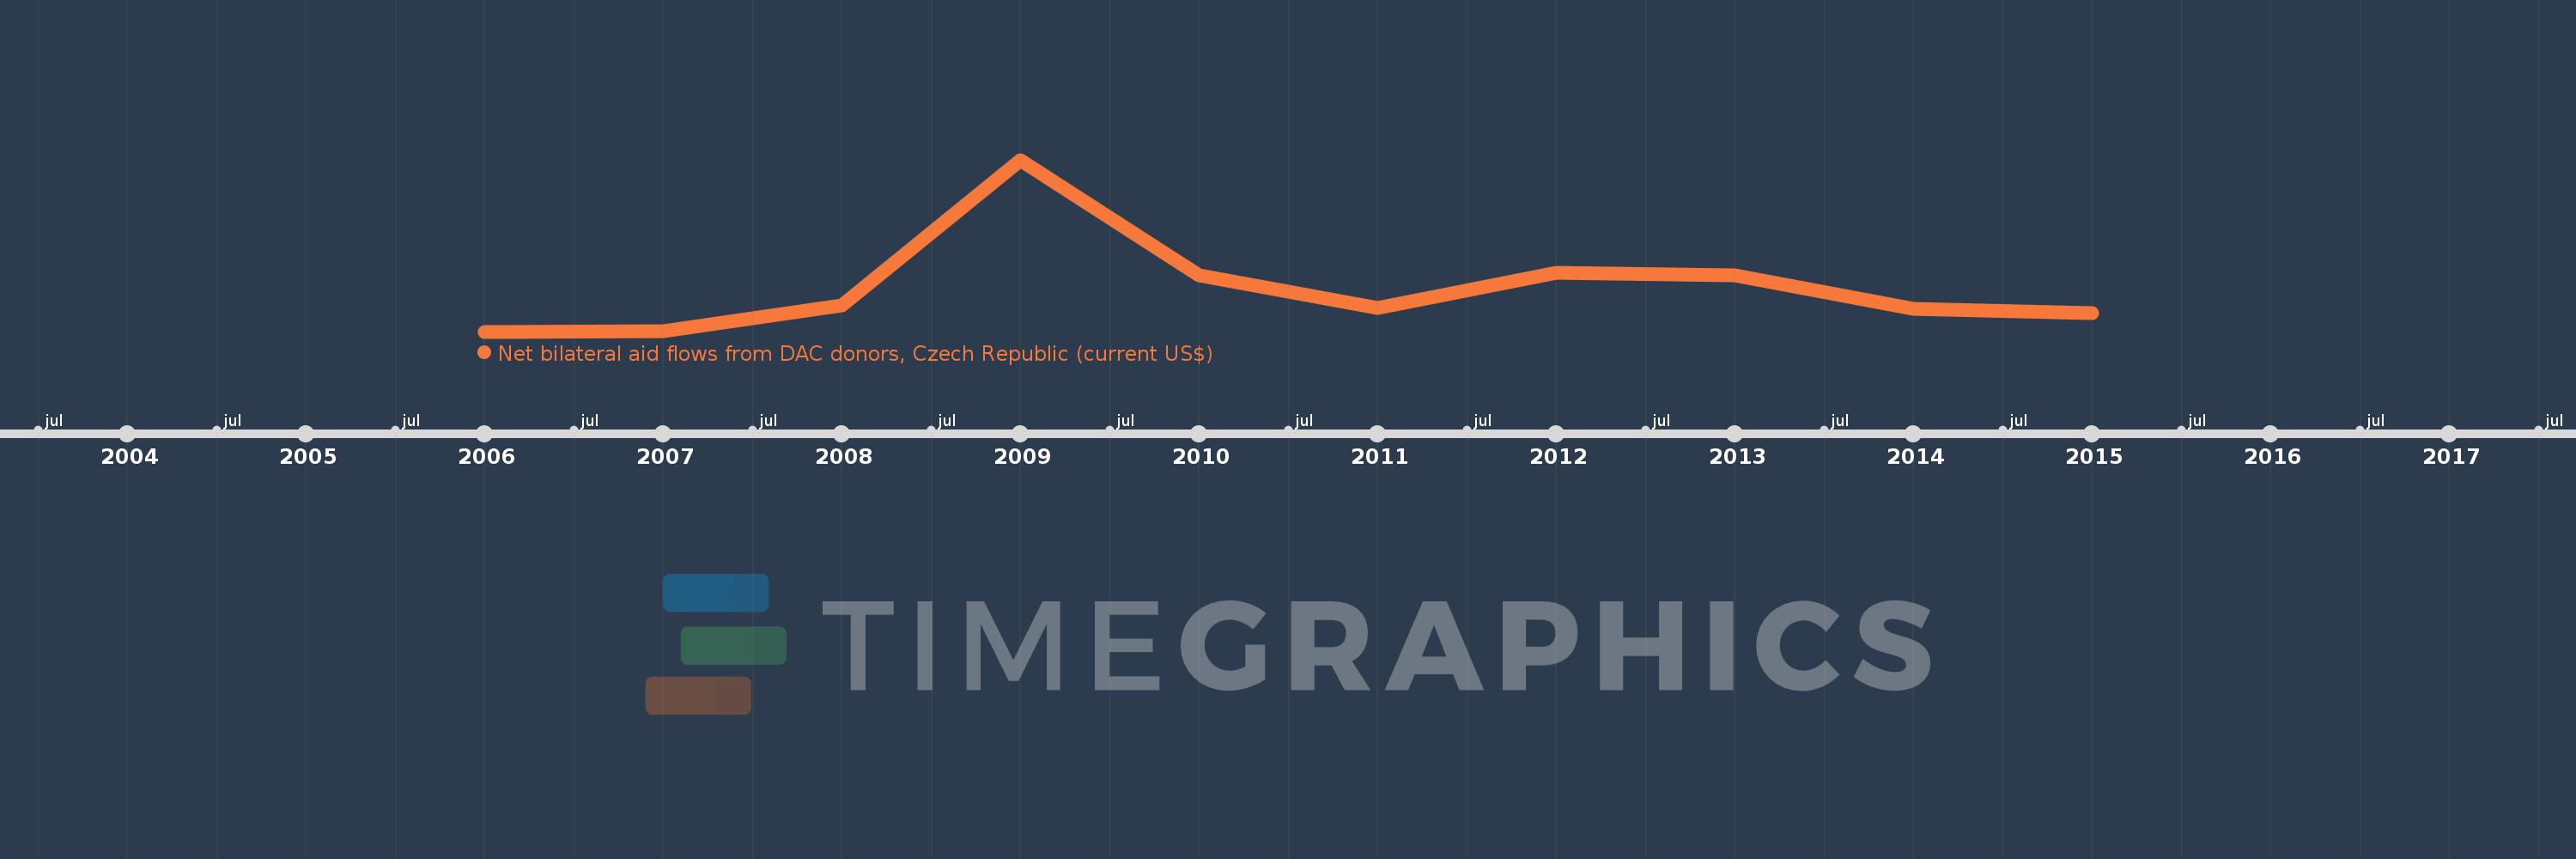
This timeline shows a graph from 2006 to 2015 of West Bank and Gaza. No data until 2005. Number of actual observations by date: 10.
Source name:
World Development Indicators
Source organization:
Development Assistance Committee of the Organisation for Economic Co-operation and Development, Geographical Distribution of Financial Flows to Developing Countries, Development Co-operation
Categories, topics:
Aid Effectiveness
Last updated:
apr 23, 2017
Indicators value changes by year
Meaning:
1.352 mln
Minimum:
230.0K
jan 1, 2006
Maximum:
4.68 mln
jan 1, 2009
At the date of observation
Value
Absolute change
Change from the previous value
jan 1, 2006
230.0K
+230.0K
0.0%
jan 1, 2007
240.0K
+10.0K
4.35%
jan 1, 2008
900.0K
+660.0K
275.0%
jan 1, 2009
4.68 mln
+3.78 mln
420.0%
jan 1, 2010
1.68 mln
-3.0 mln
-64.1%
jan 1, 2011
840.0K
-840.0K
-50.0%
jan 1, 2012
1.76 mln
+920.0K
109.52%
jan 1, 2013
1.68 mln
-80.0K
-4.55%
jan 1, 2014
810.0K
-870.0K
-51.79%
jan 1, 2015
700.0K
-110.0K
-13.58%
Ranking of countries by current statistics by years