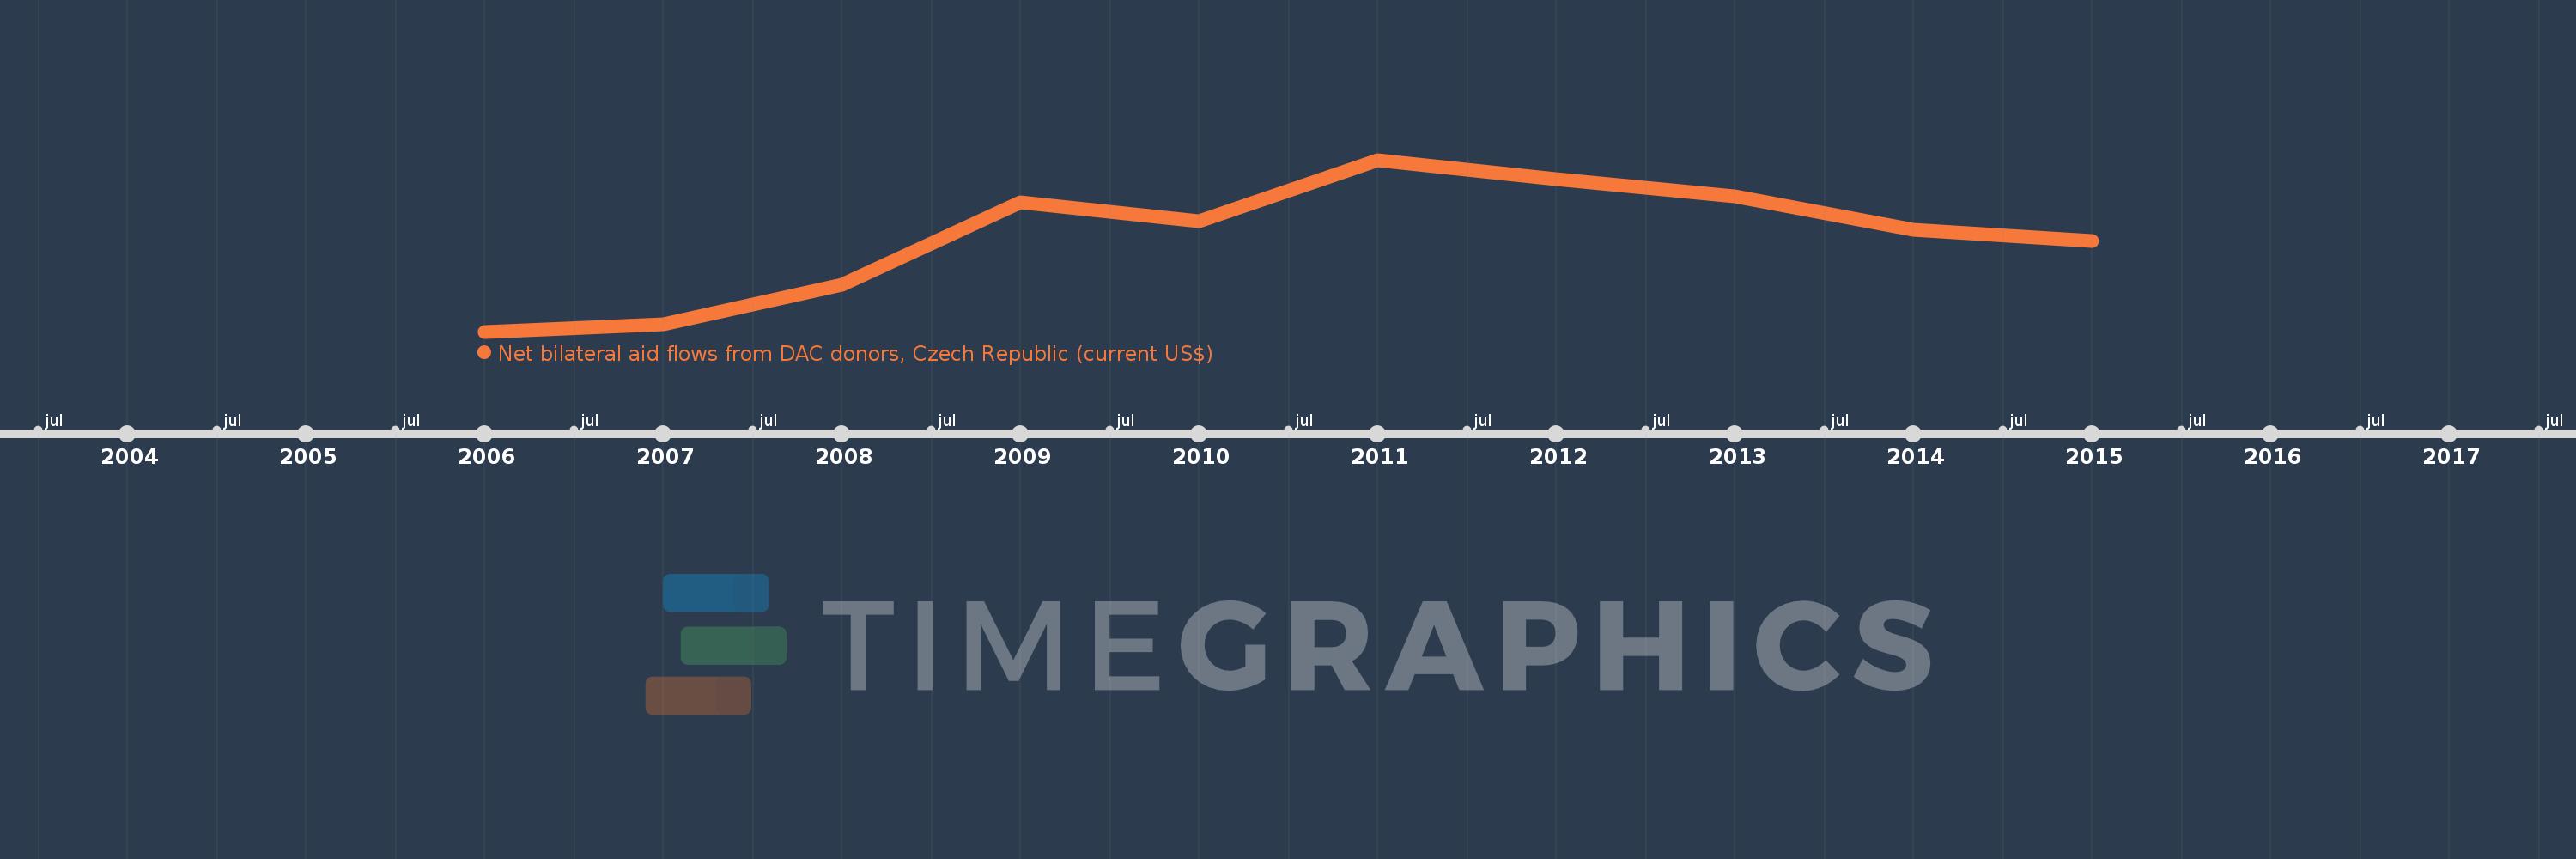
This timeline shows a graph from 2006 to 2015 of Myanmar. No data until 2005. Number of actual observations by date: 10.
Source name:
World Development Indicators
Source organization:
Development Assistance Committee of the Organisation for Economic Co-operation and Development, Geographical Distribution of Financial Flows to Developing Countries, Development Co-operation
Categories, topics:
Aid Effectiveness
Last updated:
apr 23, 2017
Indicators value changes by year
Meaning:
802.0K
Minimum:
20.0K
jan 1, 2006
Maximum:
1.44 mln
jan 1, 2011
At the date of observation
Value
Absolute change
Change from the previous value
jan 1, 2006
20.0K
+20.0K
0.0%
jan 1, 2007
80.0K
+60.0K
300.0%
jan 1, 2008
410.0K
+330.0K
412.5%
jan 1, 2009
1.09 mln
+680.0K
165.85%
jan 1, 2010
930.0K
-160.0K
-14.68%
jan 1, 2011
1.44 mln
+510.0K
54.84%
jan 1, 2012
1.28 mln
-160.0K
-11.11%
jan 1, 2013
1.14 mln
-140.0K
-10.94%
jan 1, 2014
860.0K
-280.0K
-24.56%
jan 1, 2015
770.0K
-90.0K
-10.47%
Ranking of countries by current statistics by years