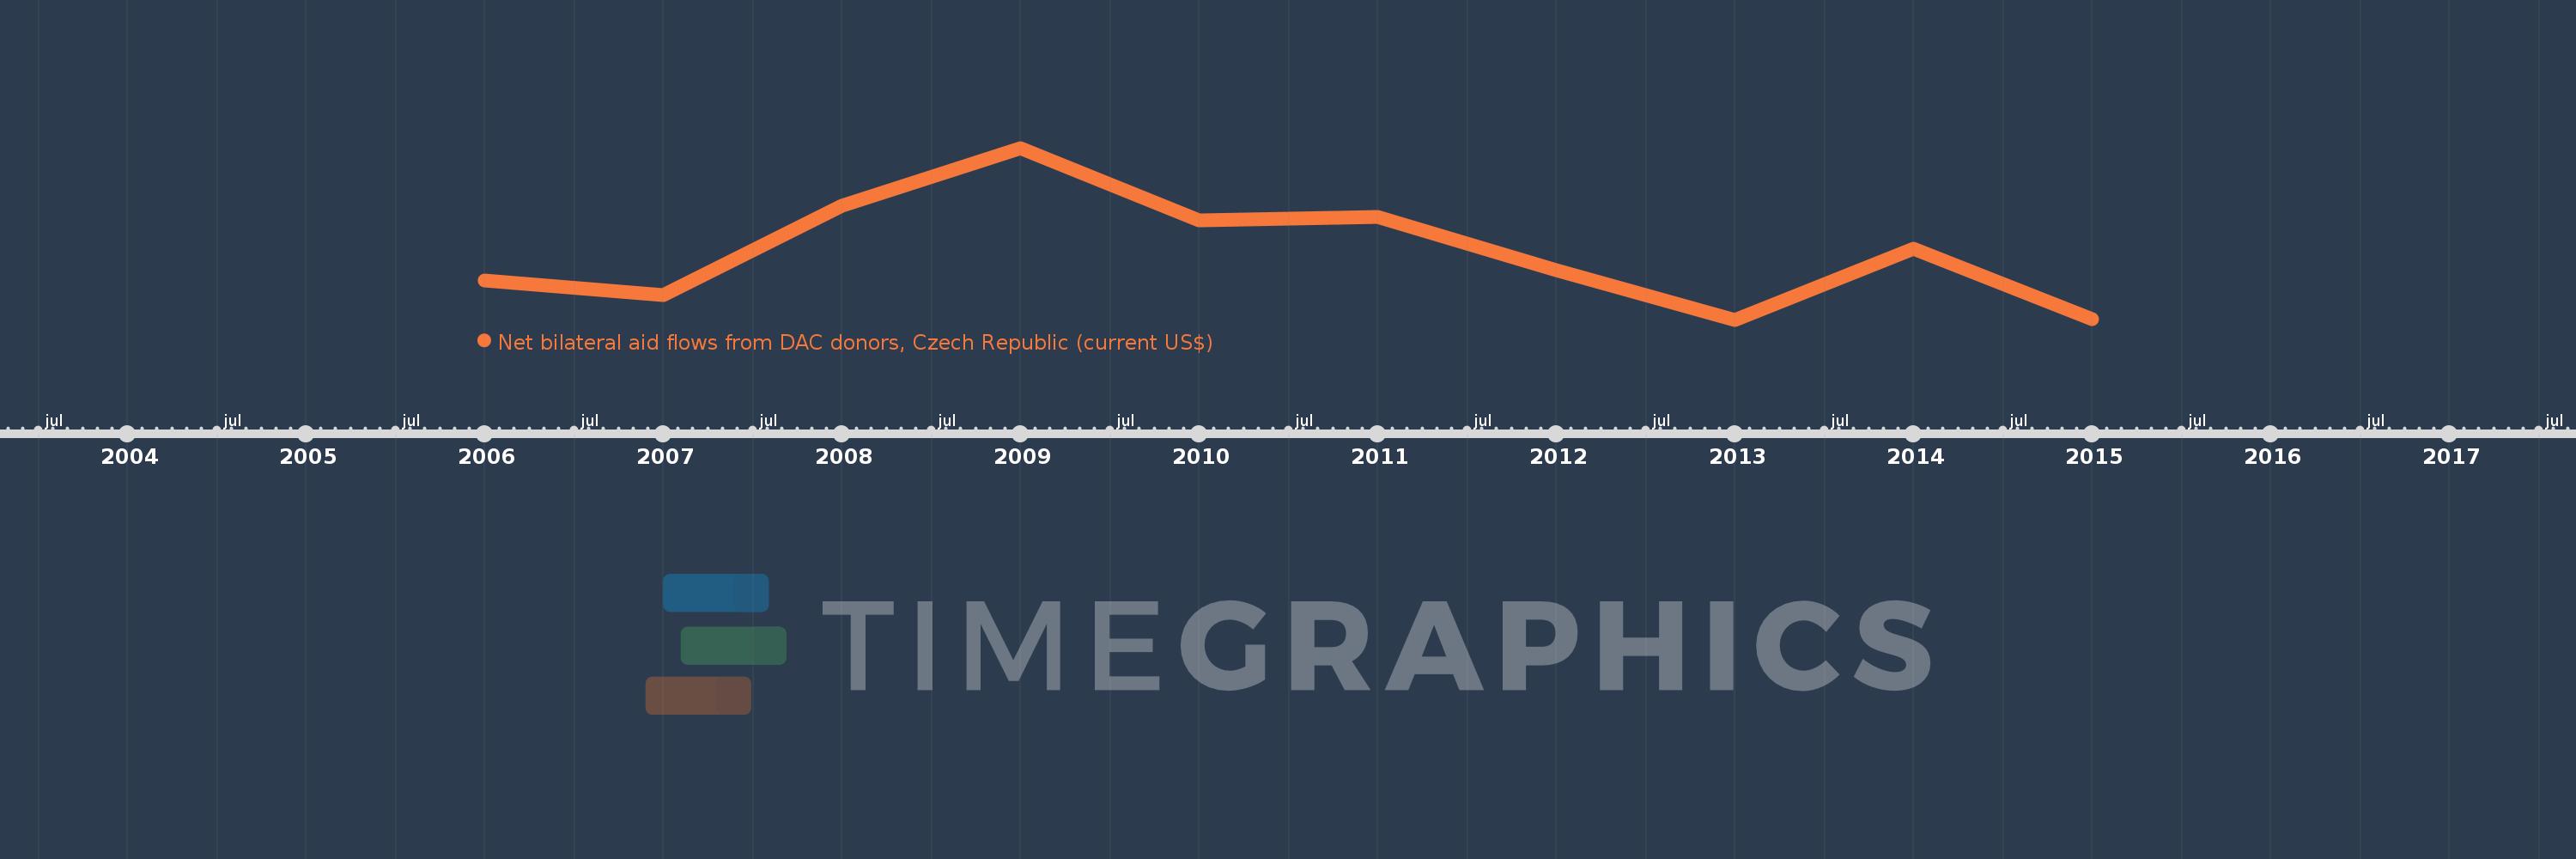
This timeline shows a graph from 2006 to 2015 of OECD members. No data until 2005. Number of actual observations by date: 10.
Source name:
World Development Indicators
Source organization:
Development Assistance Committee of the Organisation for Economic Co-operation and Development, Geographical Distribution of Financial Flows to Developing Countries, Development Co-operation
Categories, topics:
Aid Effectiveness
Last updated:
apr 23, 2017
Indicators value changes by year
Meaning:
840.0K
Minimum:
150.0K
jan 1, 2013
Maximum:
1.91 mln
jan 1, 2009
At the date of observation
Value
Absolute change
Change from the previous value
jan 1, 2006
550.0K
+550.0K
0.0%
jan 1, 2007
400.0K
-150.0K
-27.27%
jan 1, 2008
1.32 mln
+920.0K
230.0%
jan 1, 2009
1.91 mln
+590.0K
44.7%
jan 1, 2010
1.17 mln
-740.0K
-38.74%
jan 1, 2011
1.2 mln
+30.0K
2.56%
jan 1, 2012
660.0K
-540.0K
-45.0%
jan 1, 2013
150.0K
-510.0K
-77.27%
jan 1, 2014
880.0K
+730.0K
486.67%
jan 1, 2015
160.0K
-720.0K
-81.82%
Ranking of countries by current statistics by years