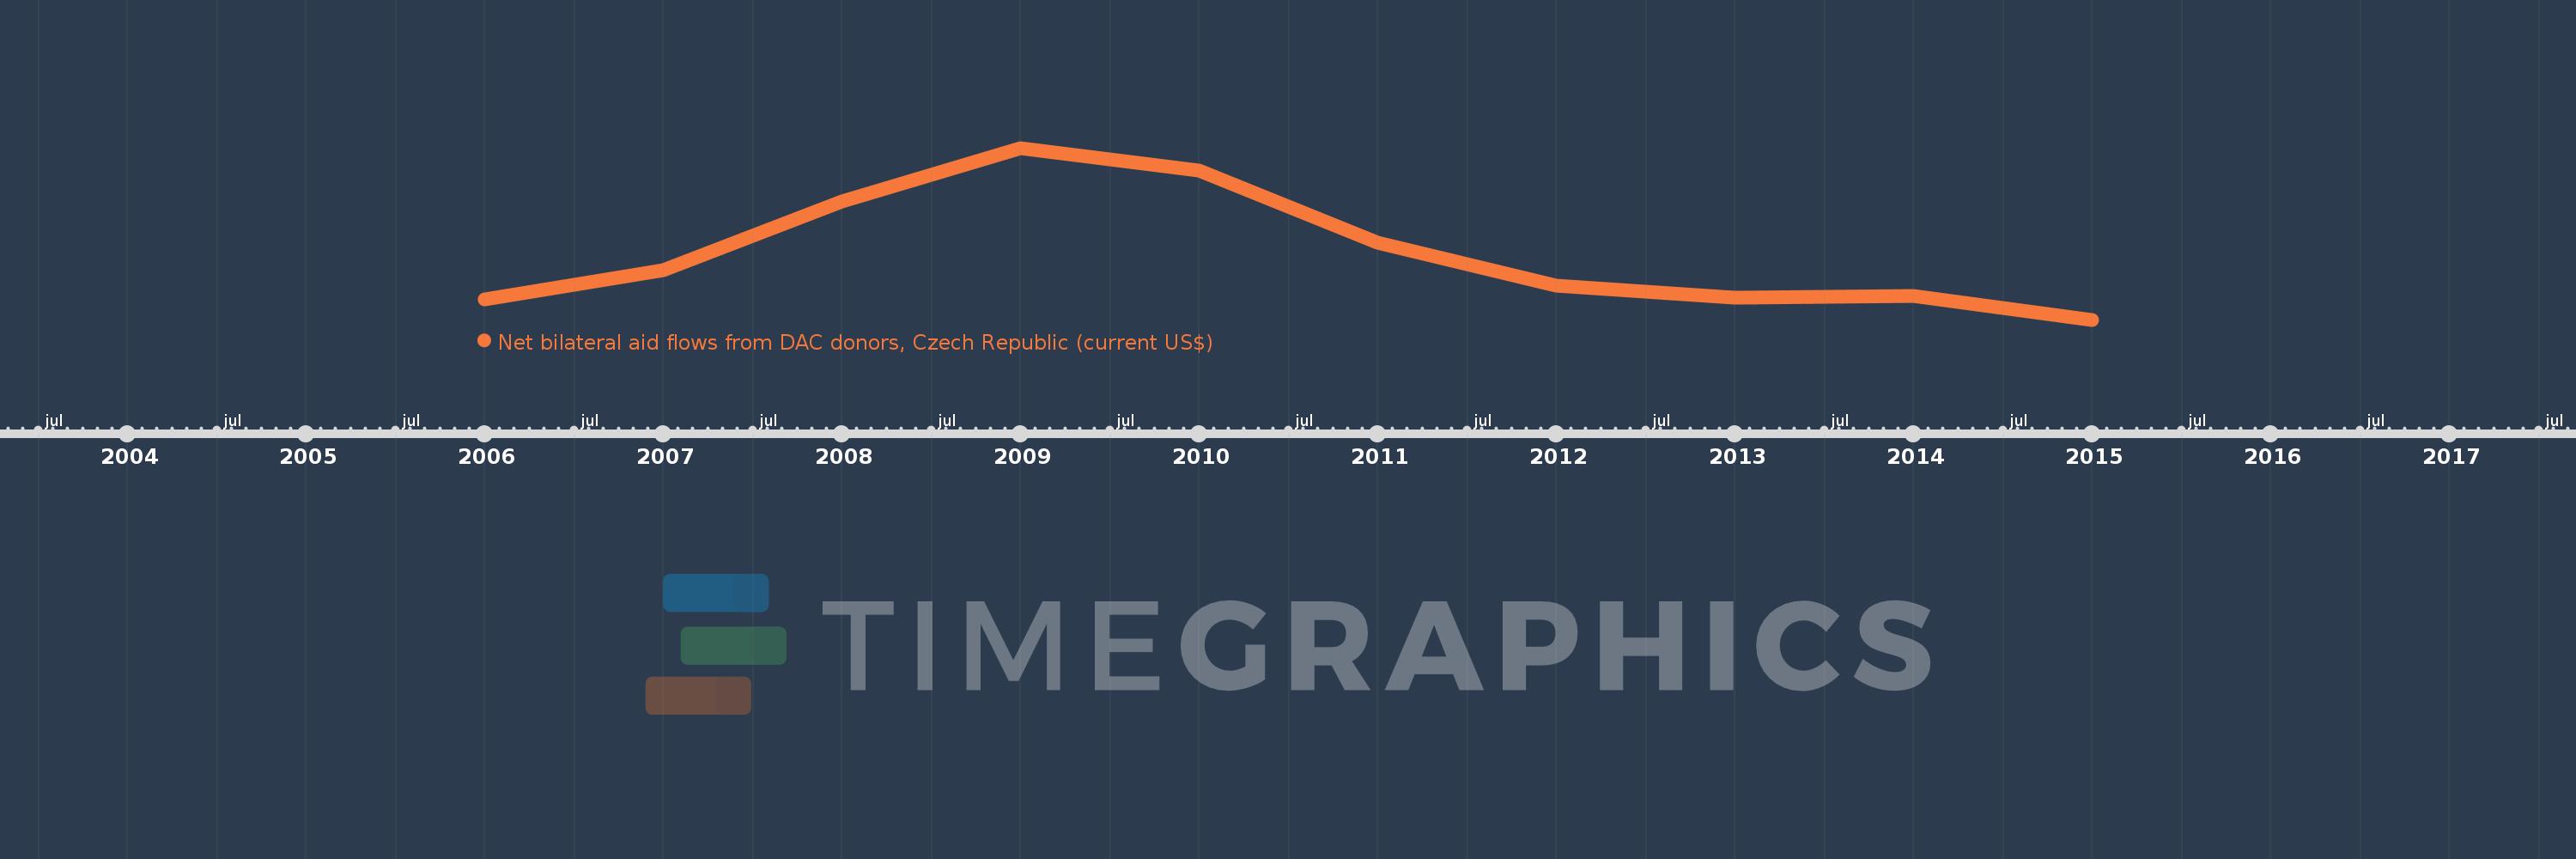
This timeline shows a graph from 2006 to 2015 of Vietnam. No data until 2005. Number of actual observations by date: 10.
Source name:
World Development Indicators
Source organization:
Development Assistance Committee of the Organisation for Economic Co-operation and Development, Geographical Distribution of Financial Flows to Developing Countries, Development Co-operation
Categories, topics:
Aid Effectiveness
Last updated:
apr 23, 2017
Indicators value changes by year
Meaning:
2.189 mln
Minimum:
1.09 mln
jan 1, 2015
Maximum:
3.93 mln
jan 1, 2009
At the date of observation
Value
Absolute change
Change from the previous value
jan 1, 2006
1.42 mln
+1.42 mln
0.0%
jan 1, 2007
1.91 mln
+490.0K
34.51%
jan 1, 2008
3.04 mln
+1.13 mln
59.16%
jan 1, 2009
3.93 mln
+890.0K
29.28%
jan 1, 2010
3.55 mln
-380.0K
-9.67%
jan 1, 2011
2.36 mln
-1.19 mln
-33.52%
jan 1, 2012
1.66 mln
-700.0K
-29.66%
jan 1, 2013
1.45 mln
-210.0K
-12.65%
jan 1, 2014
1.48 mln
+30.0K
2.07%
jan 1, 2015
1.09 mln
-390.0K
-26.35%
Ranking of countries by current statistics by years