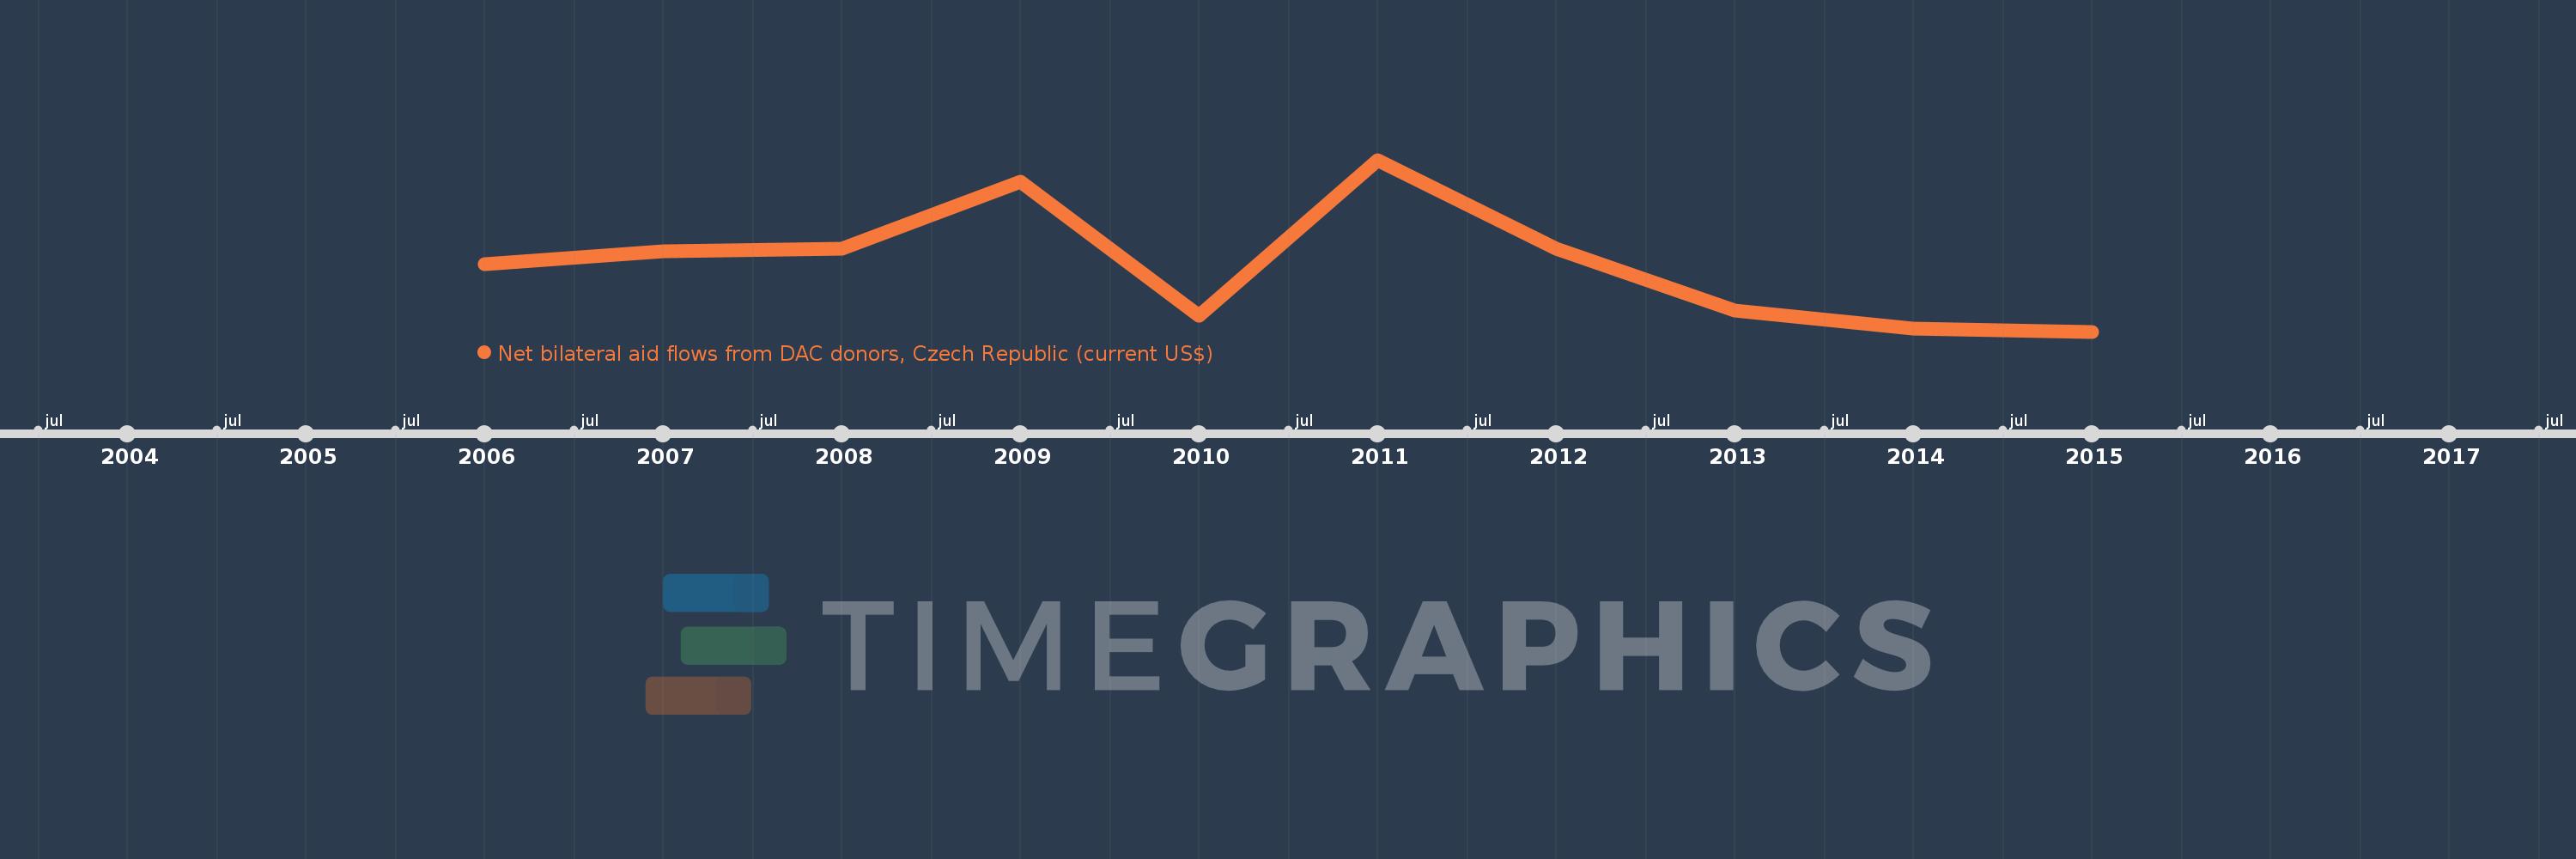
This timeline shows a graph from 2006 to 2015 of Kyrgyz Republic. No data until 2005. Number of actual observations by date: 10.
Source name:
World Development Indicators
Source organization:
Development Assistance Committee of the Organisation for Economic Co-operation and Development, Geographical Distribution of Financial Flows to Developing Countries, Development Co-operation
Categories, topics:
Aid Effectiveness
Last updated:
apr 23, 2017
Indicators value changes by year
Meaning:
492.0K
Minimum:
240.0K
jan 1, 2015
Maximum:
880.0K
jan 1, 2011
At the date of observation
Value
Absolute change
Change from the previous value
jan 1, 2006
490.0K
+490.0K
0.0%
jan 1, 2007
540.0K
+50.0K
10.2%
jan 1, 2008
550.0K
+10.0K
1.85%
jan 1, 2009
800.0K
+250.0K
45.45%
jan 1, 2010
300.0K
-500.0K
-62.5%
jan 1, 2011
880.0K
+580.0K
193.33%
jan 1, 2012
550.0K
-330.0K
-37.5%
jan 1, 2013
320.0K
-230.0K
-41.82%
jan 1, 2014
250.0K
-70.0K
-21.88%
jan 1, 2015
240.0K
-10.0K
-4.0%
Ranking of countries by current statistics by years