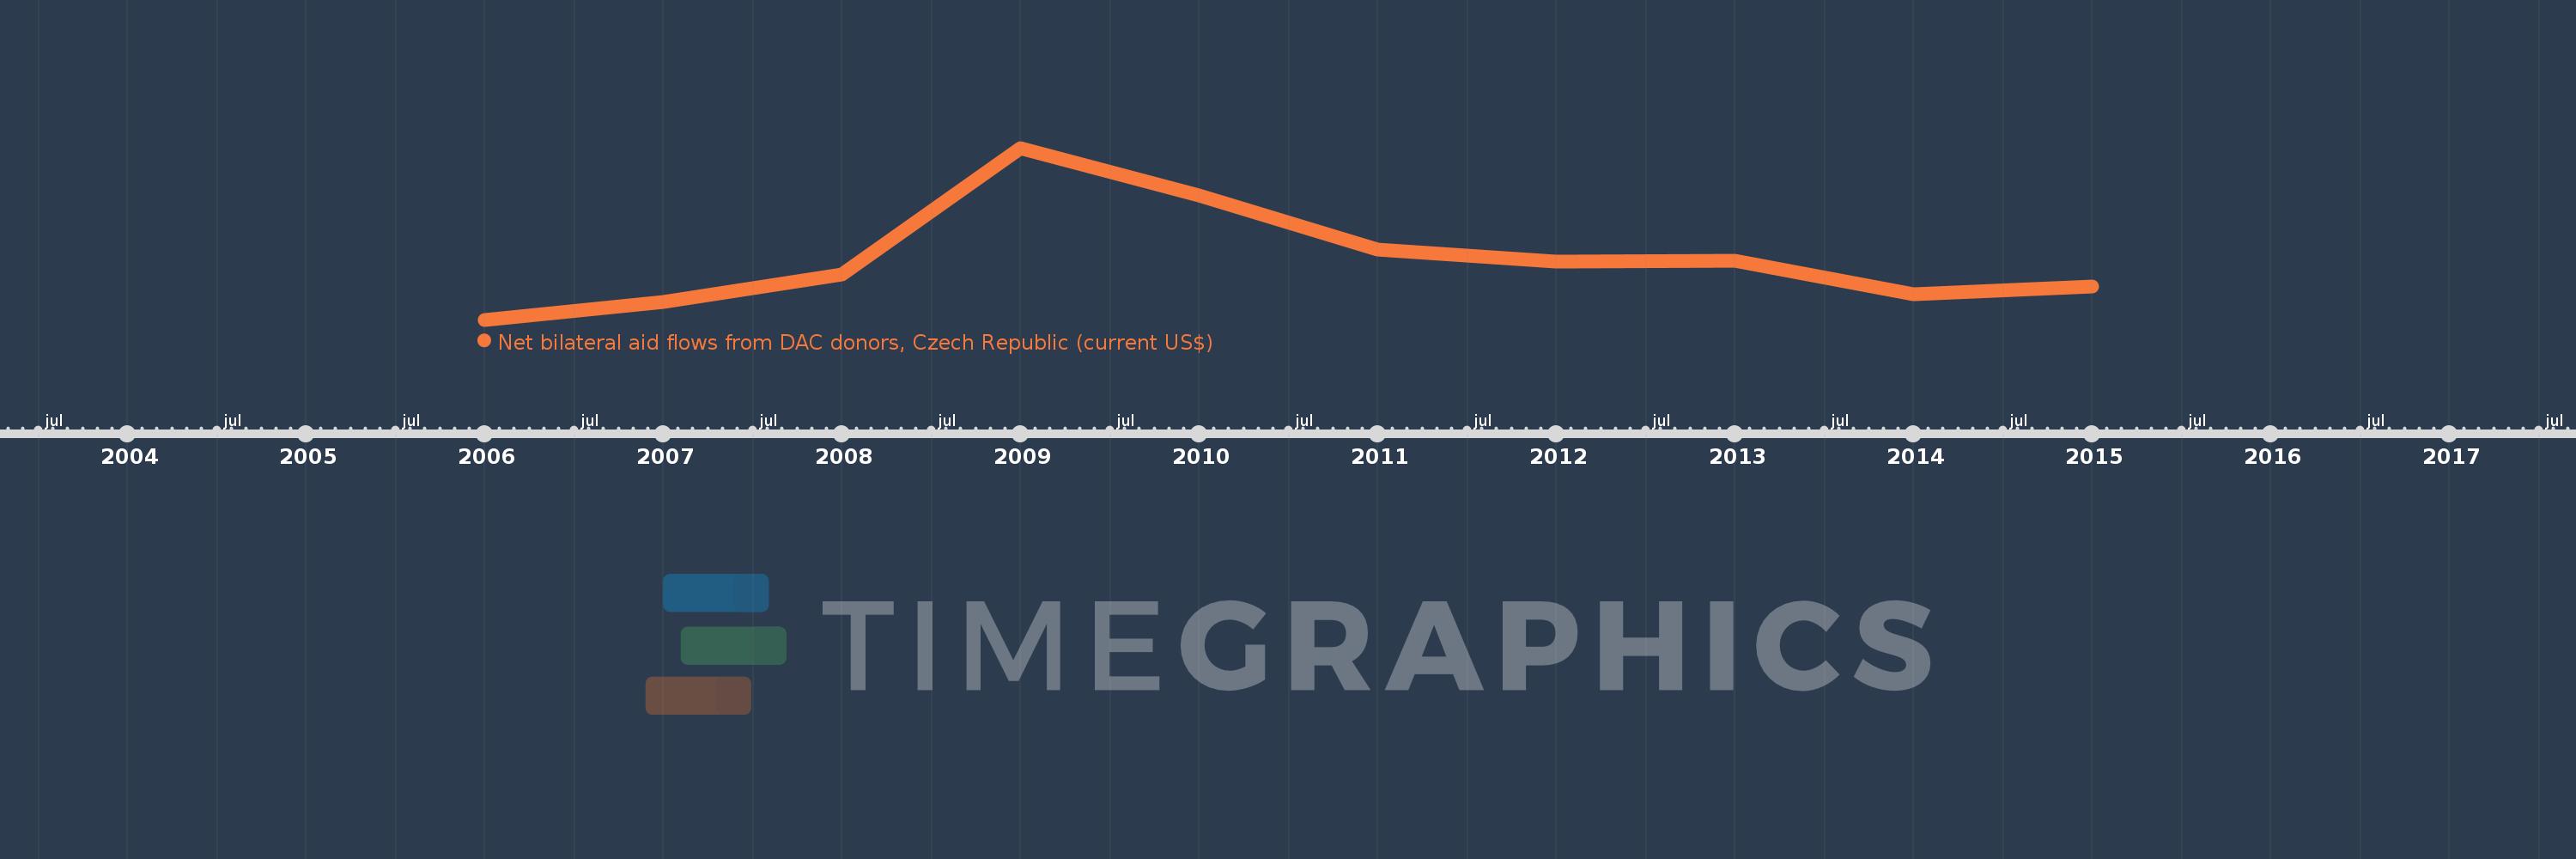
This timeline shows a graph from 2006 to 2015 of Least developed countries: UN classification. No data until 2005. Number of actual observations by date: 10.
Source name:
World Development Indicators
Source organization:
Development Assistance Committee of the Organisation for Economic Co-operation and Development, Geographical Distribution of Financial Flows to Developing Countries, Development Co-operation
Categories, topics:
Aid Effectiveness
Last updated:
apr 23, 2017
Indicators value changes by year
Meaning:
21.769 mln
Minimum:
5.13 mln
jan 1, 2006
Maximum:
52.38 mln
jan 1, 2009
At the date of observation
Value
Absolute change
Change from the previous value
jan 1, 2006
5.13 mln
+5.13 mln
0.0%
jan 1, 2007
9.92 mln
+4.79 mln
93.37%
jan 1, 2008
17.59 mln
+7.67 mln
77.32%
jan 1, 2009
52.38 mln
+34.79 mln
197.78%
jan 1, 2010
39.21 mln
-13.17 mln
-25.14%
jan 1, 2011
24.46 mln
-14.75 mln
-37.62%
jan 1, 2012
21.22 mln
-3.24 mln
-13.25%
jan 1, 2013
21.33 mln
+110.0K
0.52%
jan 1, 2014
12.11 mln
-9.22 mln
-43.23%
jan 1, 2015
14.34 mln
+2.23 mln
18.41%
Ranking of countries by current statistics by years