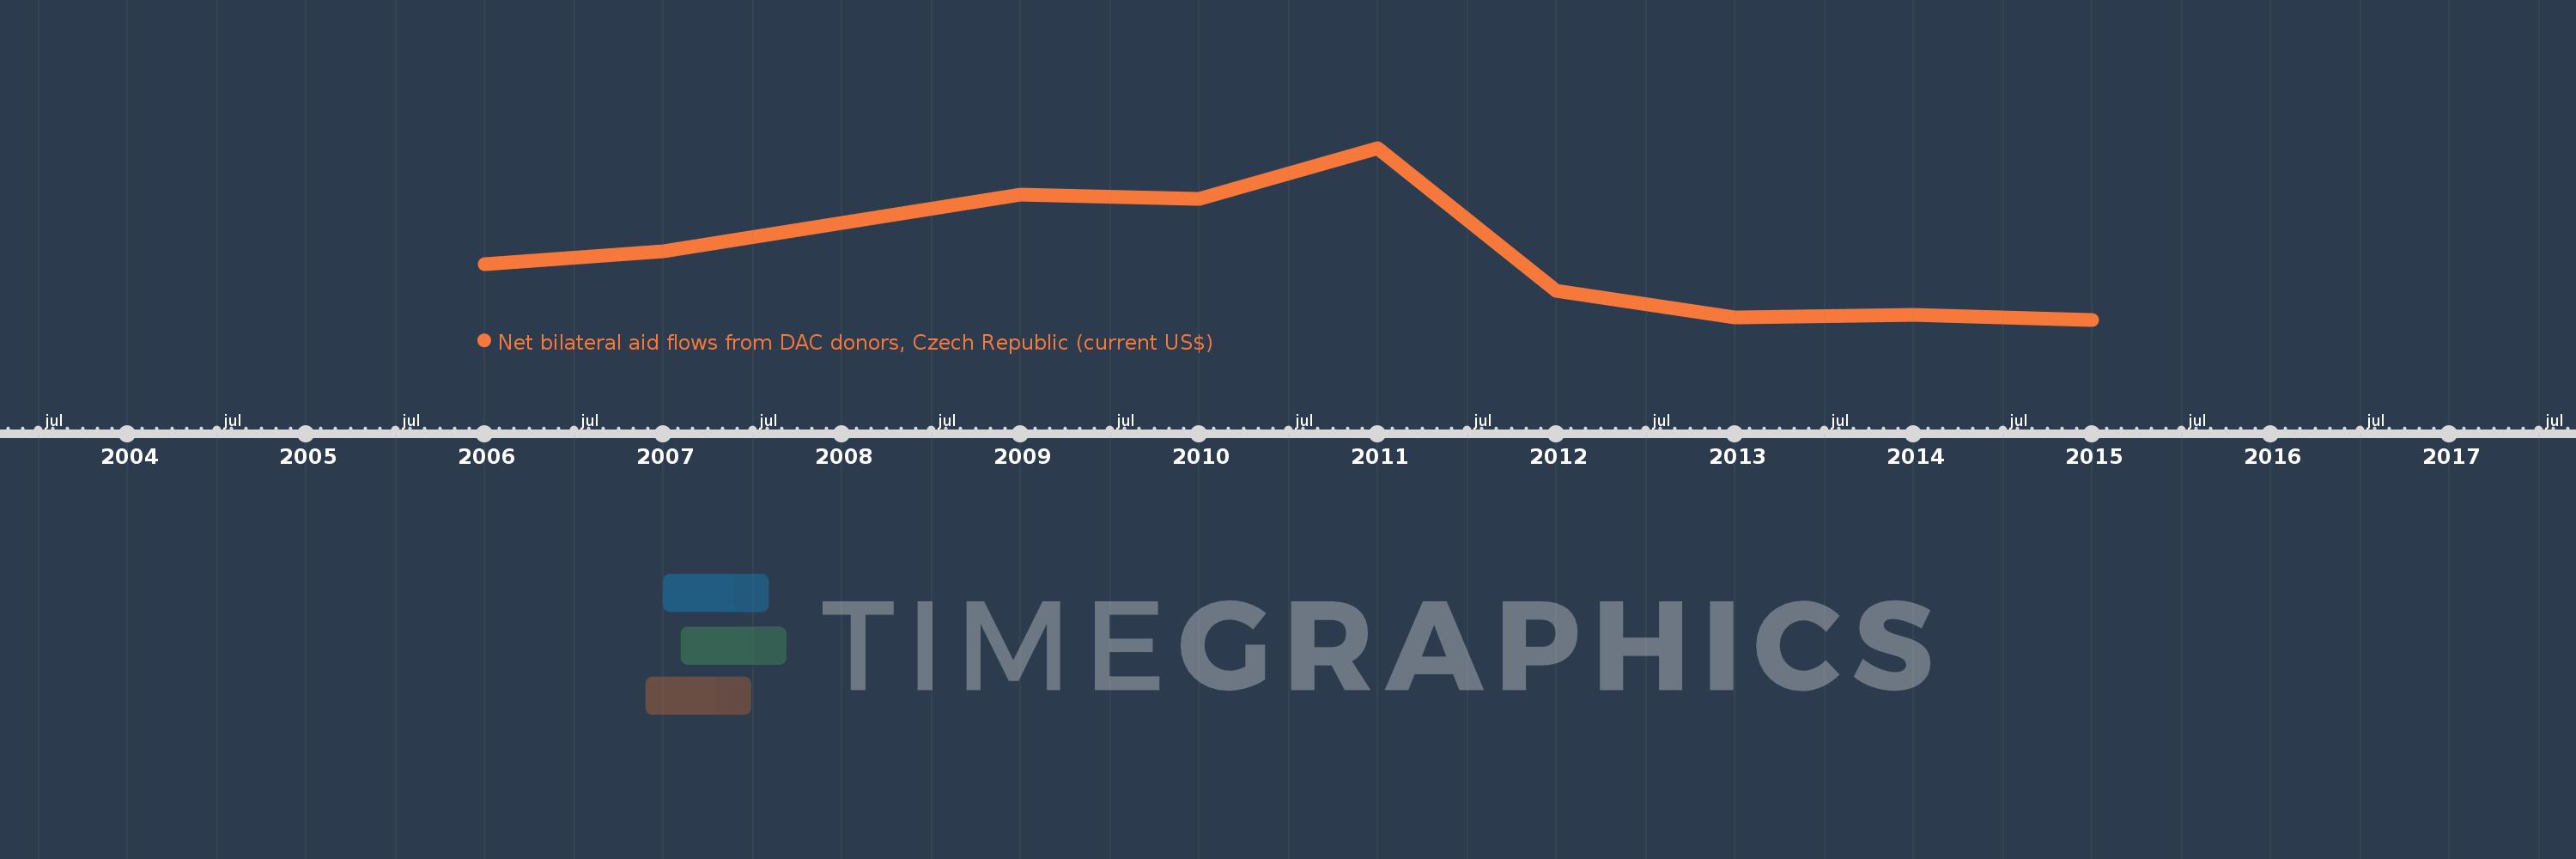
This timeline shows a graph from 2006 to 2015 of Latin America & the Caribbean (IDA & IBRD countries). No data until 2005. Number of actual observations by date: 10.
Source name:
World Development Indicators
Source organization:
Development Assistance Committee of the Organisation for Economic Co-operation and Development, Geographical Distribution of Financial Flows to Developing Countries, Development Co-operation
Categories, topics:
Aid Effectiveness
Last updated:
apr 23, 2017
Indicators value changes by year
Meaning:
2.405 mln
Minimum:
670.0K
jan 1, 2015
Maximum:
5.09 mln
jan 1, 2011
At the date of observation
Value
Absolute change
Change from the previous value
jan 1, 2006
2.1 mln
+2.1 mln
0.0%
jan 1, 2007
2.44 mln
+340.0K
16.19%
jan 1, 2008
3.15 mln
+710.0K
29.1%
jan 1, 2009
3.89 mln
+740.0K
23.49%
jan 1, 2010
3.78 mln
-110.0K
-2.83%
jan 1, 2011
5.09 mln
+1.31 mln
34.66%
jan 1, 2012
1.41 mln
-3.68 mln
-72.3%
jan 1, 2013
720.0K
-690.0K
-48.94%
jan 1, 2014
800.0K
+80.0K
11.11%
jan 1, 2015
670.0K
-130.0K
-16.25%
Ranking of countries by current statistics by years