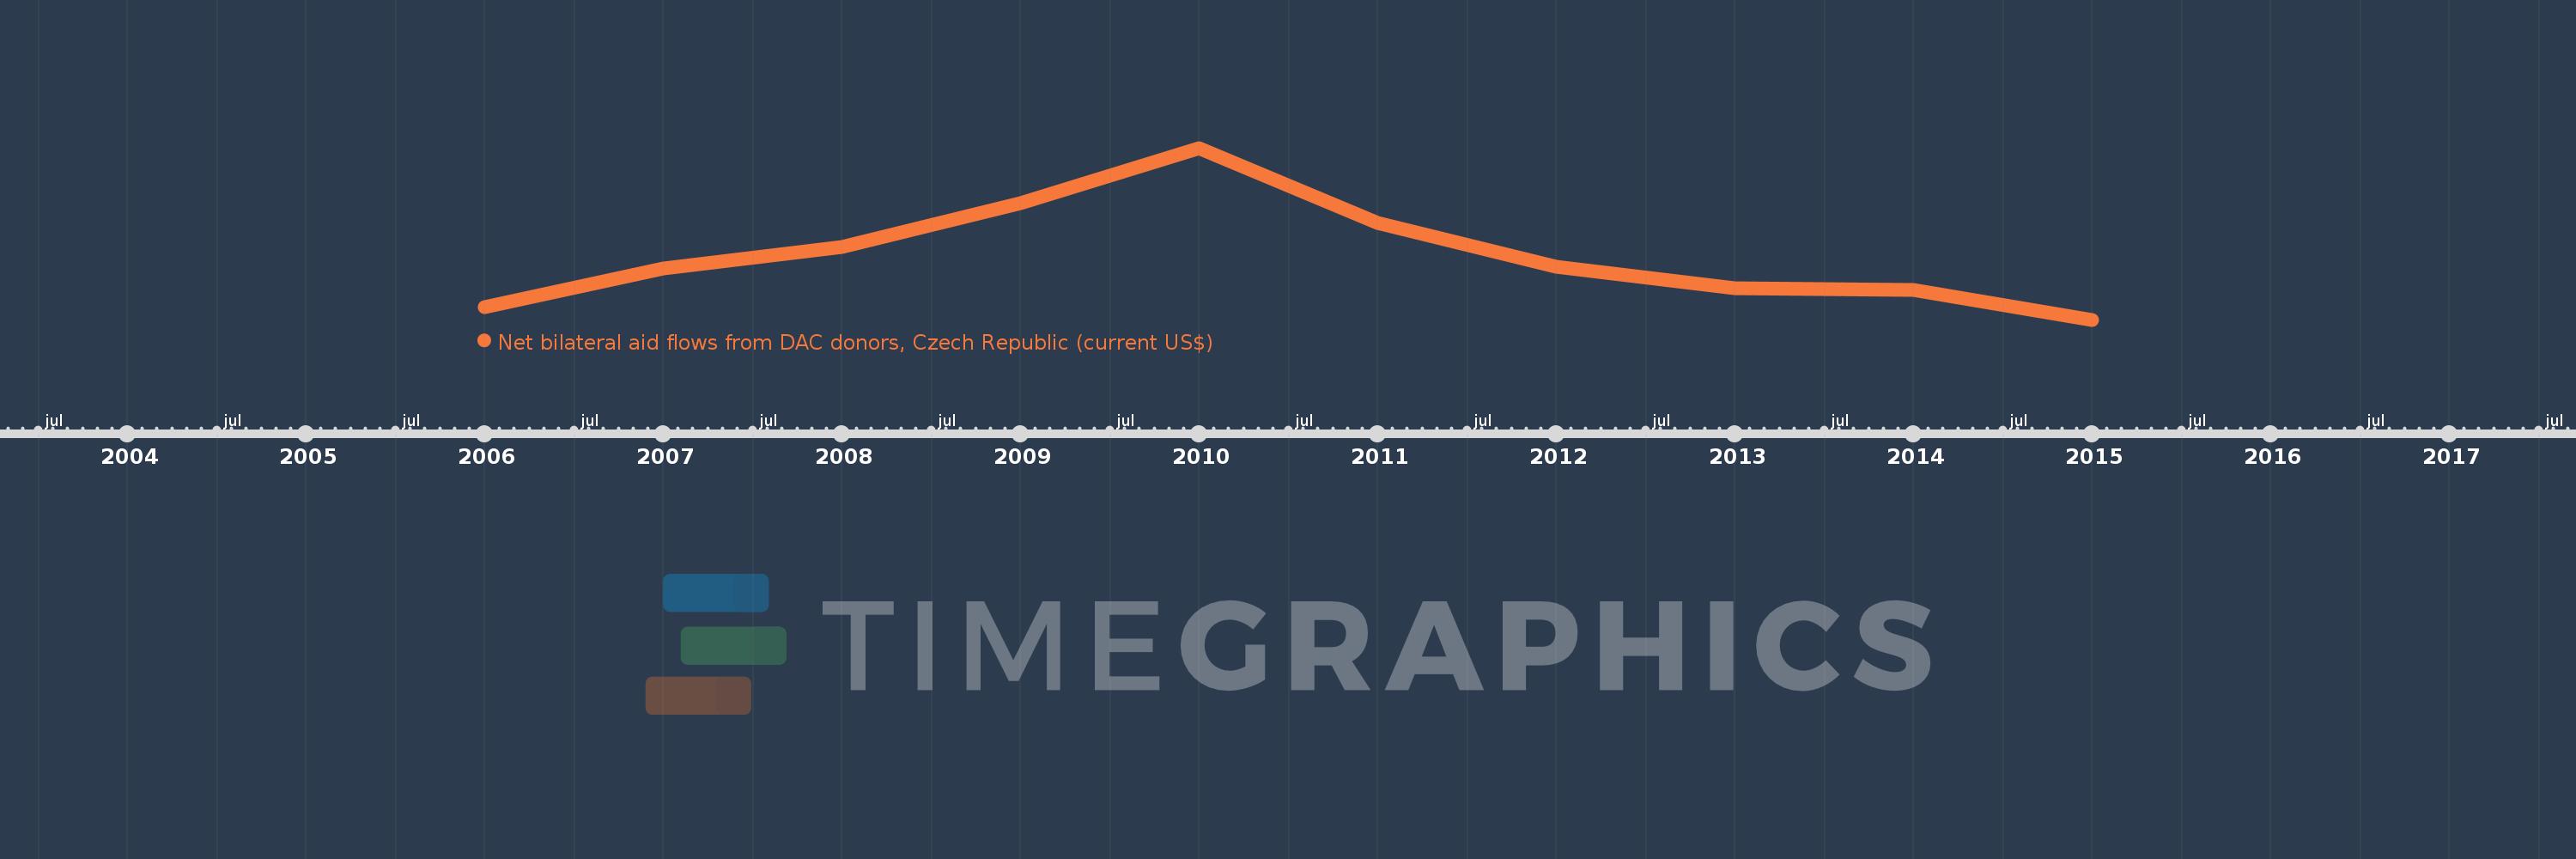
This timeline shows a graph from 2006 to 2015 of East Asia & Pacific (excluding high income). No data until 2005. Number of actual observations by date: 10.
Source name:
World Development Indicators
Source organization:
Development Assistance Committee of the Organisation for Economic Co-operation and Development, Geographical Distribution of Financial Flows to Developing Countries, Development Co-operation
Categories, topics:
Aid Effectiveness
Last updated:
apr 23, 2017
Indicators value changes by year
Meaning:
9.888 mln
Minimum:
6.32 mln
jan 1, 2015
Maximum:
15.96 mln
jan 1, 2010
At the date of observation
Value
Absolute change
Change from the previous value
jan 1, 2006
7.02 mln
+7.02 mln
0.0%
jan 1, 2007
9.19 mln
+2.17 mln
30.91%
jan 1, 2008
10.42 mln
+1.23 mln
13.38%
jan 1, 2009
12.88 mln
+2.46 mln
23.61%
jan 1, 2010
15.96 mln
+3.08 mln
23.91%
jan 1, 2011
11.75 mln
-4.21 mln
-26.38%
jan 1, 2012
9.27 mln
-2.48 mln
-21.11%
jan 1, 2013
8.1 mln
-1.17 mln
-12.62%
jan 1, 2014
7.97 mln
-130.0K
-1.6%
jan 1, 2015
6.32 mln
-1.65 mln
-20.7%
Ranking of countries by current statistics by years