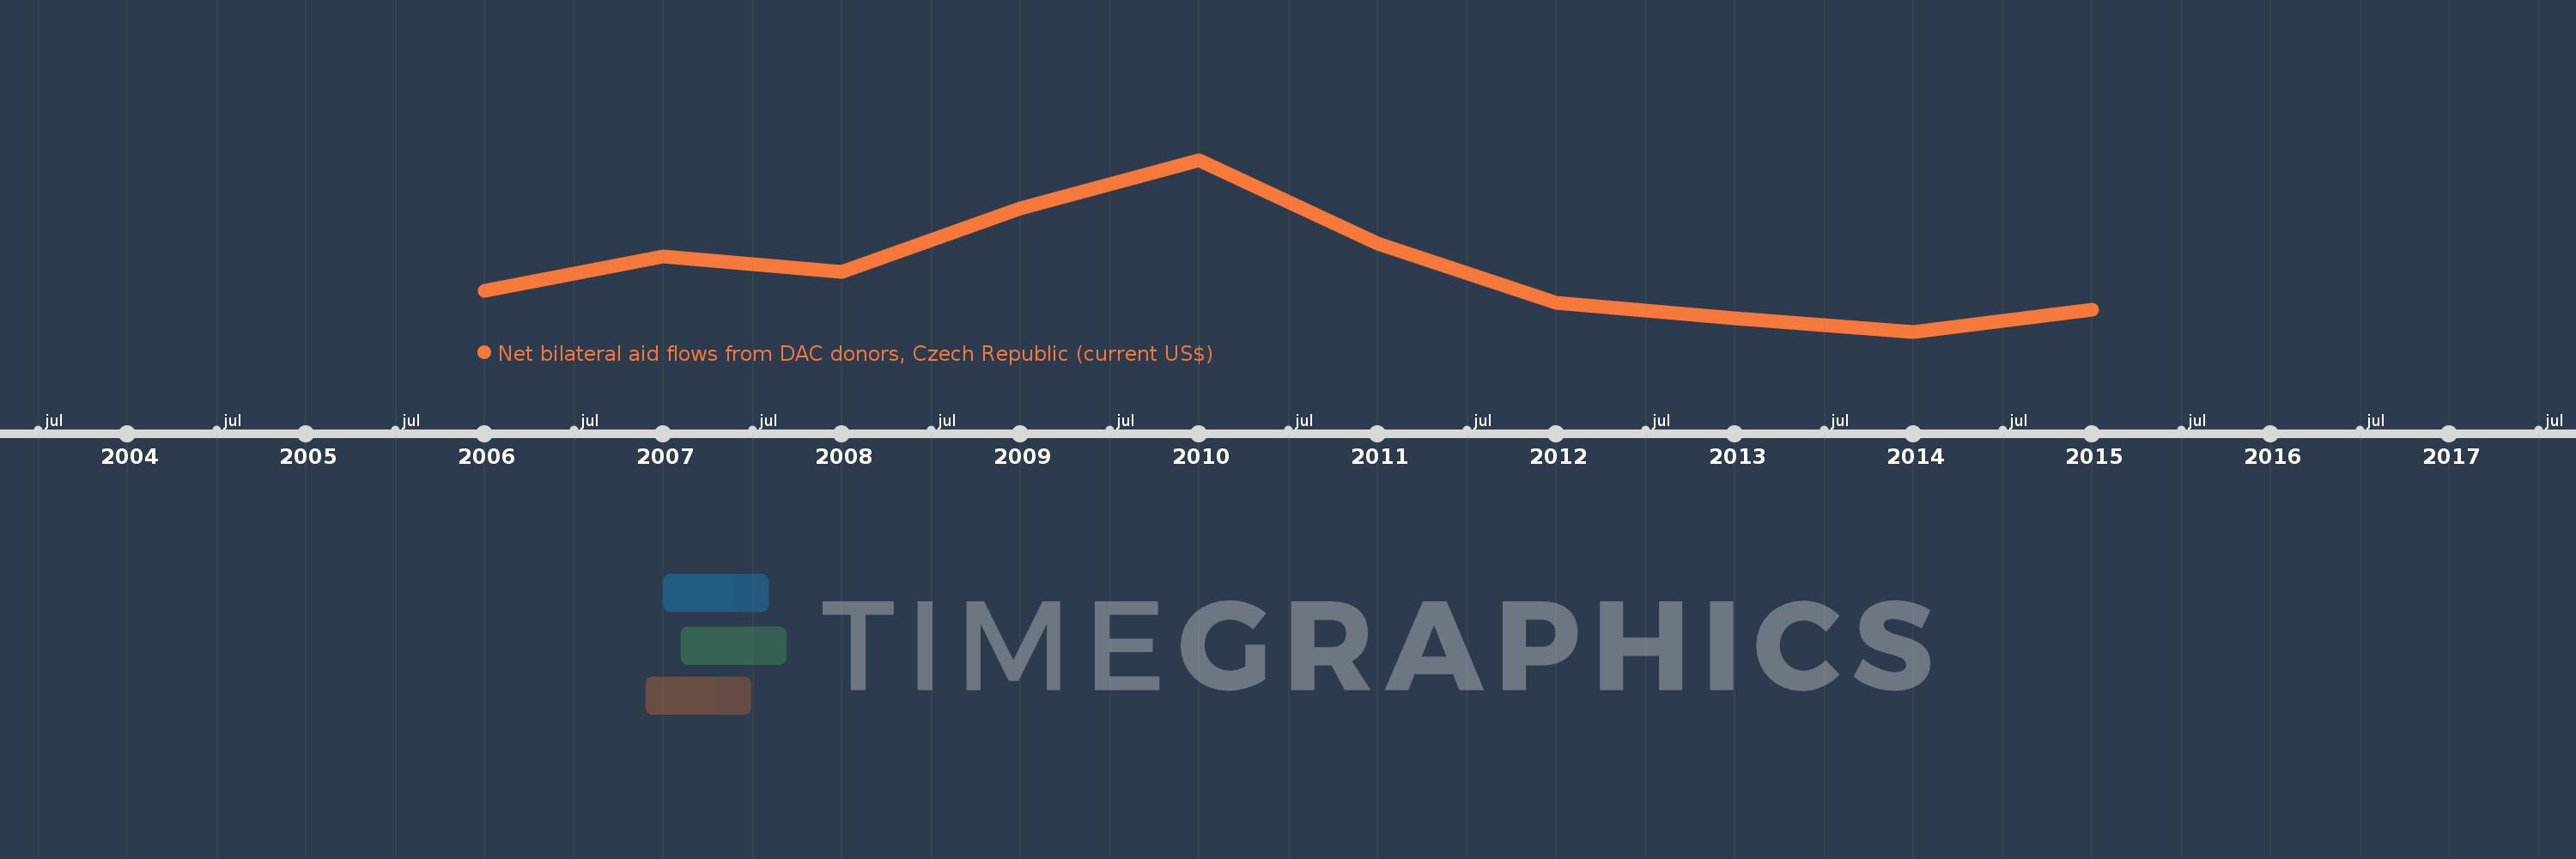
This timeline shows a graph from 2006 to 2015 of Middle income. No data until 2005. Number of actual observations by date: 10.
Source name:
World Development Indicators
Source organization:
Development Assistance Committee of the Organisation for Economic Co-operation and Development, Geographical Distribution of Financial Flows to Developing Countries, Development Co-operation
Categories, topics:
Aid Effectiveness
Last updated:
apr 23, 2017
Indicators value changes by year
Meaning:
47.45 mln
Minimum:
37.72 mln
jan 1, 2014
Maximum:
64.55 mln
jan 1, 2010
At the date of observation
Value
Absolute change
Change from the previous value
jan 1, 2006
44.14 mln
+44.14 mln
0.0%
jan 1, 2007
49.43 mln
+5.29 mln
11.98%
jan 1, 2008
47.1 mln
-2.33 mln
-4.71%
jan 1, 2009
56.98 mln
+9.88 mln
20.98%
jan 1, 2010
64.55 mln
+7.57 mln
13.29%
jan 1, 2011
51.45 mln
-13.1 mln
-20.29%
jan 1, 2012
42.22 mln
-9.23 mln
-17.94%
jan 1, 2013
39.75 mln
-2.47 mln
-5.85%
jan 1, 2014
37.72 mln
-2.03 mln
-5.11%
jan 1, 2015
41.16 mln
+3.44 mln
9.12%
Ranking of countries by current statistics by years