This timeline shows a graph from 2006 to 2015 of Iraq. No data until 2005. Number of actual observations by date: 10.
Source name:
World Development Indicators
Source organization:
Development Assistance Committee of the Organisation for Economic Co-operation and Development, Geographical Distribution of Financial Flows to Developing Countries, Development Co-operation
Categories, topics:
Aid Effectiveness
Last updated:
apr 23, 2017
Indicators value changes by year
Meaning:
2.454 mln
Minimum:
280.0K
jan 1, 2013
Maximum:
11.8 mln
jan 1, 2007
At the date of observation
Value
Absolute change
Change from the previous value
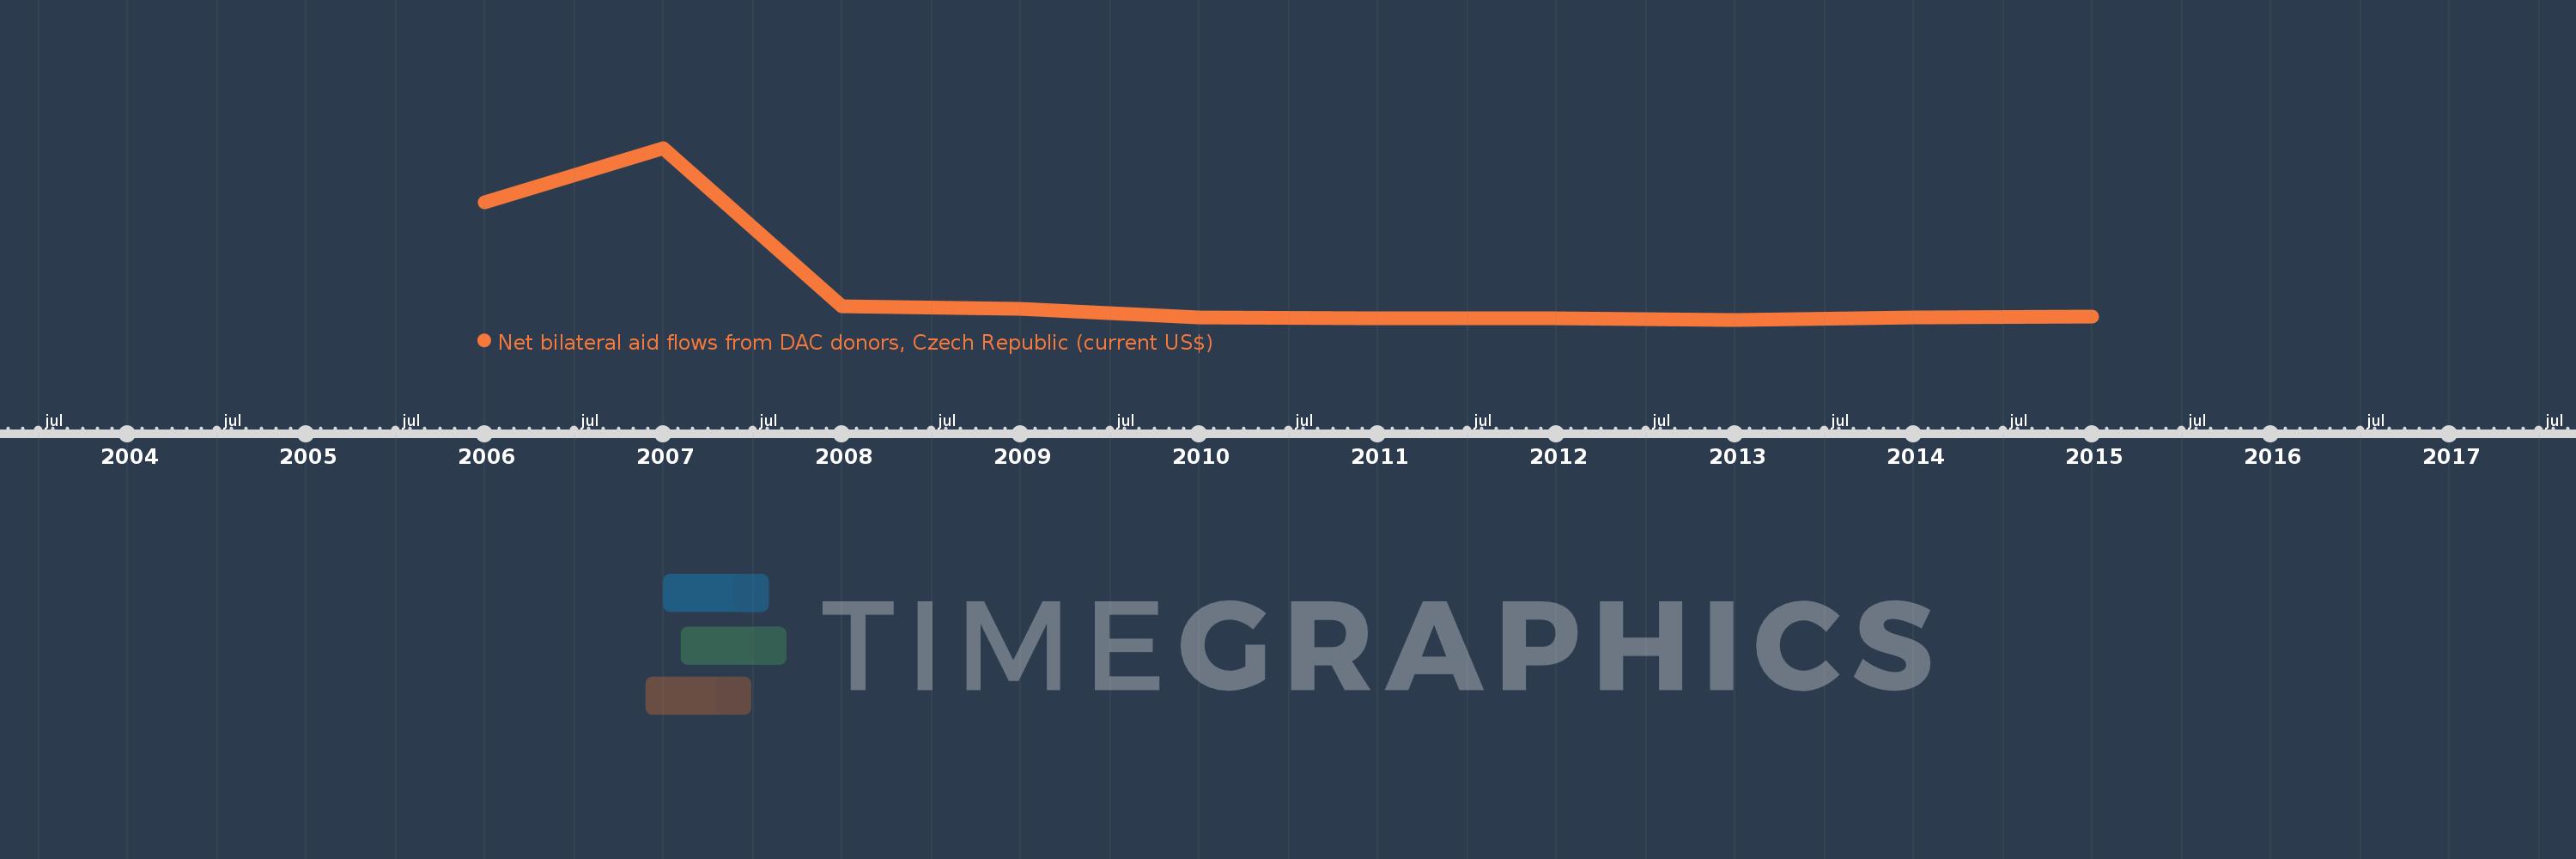
jan 1, 2006
8.13 mln
+8.13 mln
0.0%
jan 1, 2007
11.8 mln
+3.67 mln
45.14%
jan 1, 2008
1.2 mln
-10.6 mln
-89.83%
jan 1, 2009
990.0K
-210.0K
-17.5%
jan 1, 2010
440.0K
-550.0K
-55.56%
jan 1, 2011
360.0K
-80.0K
-18.18%
jan 1, 2012
380.0K
+20.0K
5.56%
jan 1, 2013
280.0K
-100.0K
-26.32%
jan 1, 2014
440.0K
+160.0K
57.14%
jan 1, 2015
520.0K
+80.0K
18.18%
Ranking of countries by current statistics by years