29
/
en
AIzaSyAYiBZKx7MnpbEhh9jyipgxe19OcubqV5w
April 1, 2024
95778
Burundi
BDI
true
2
1
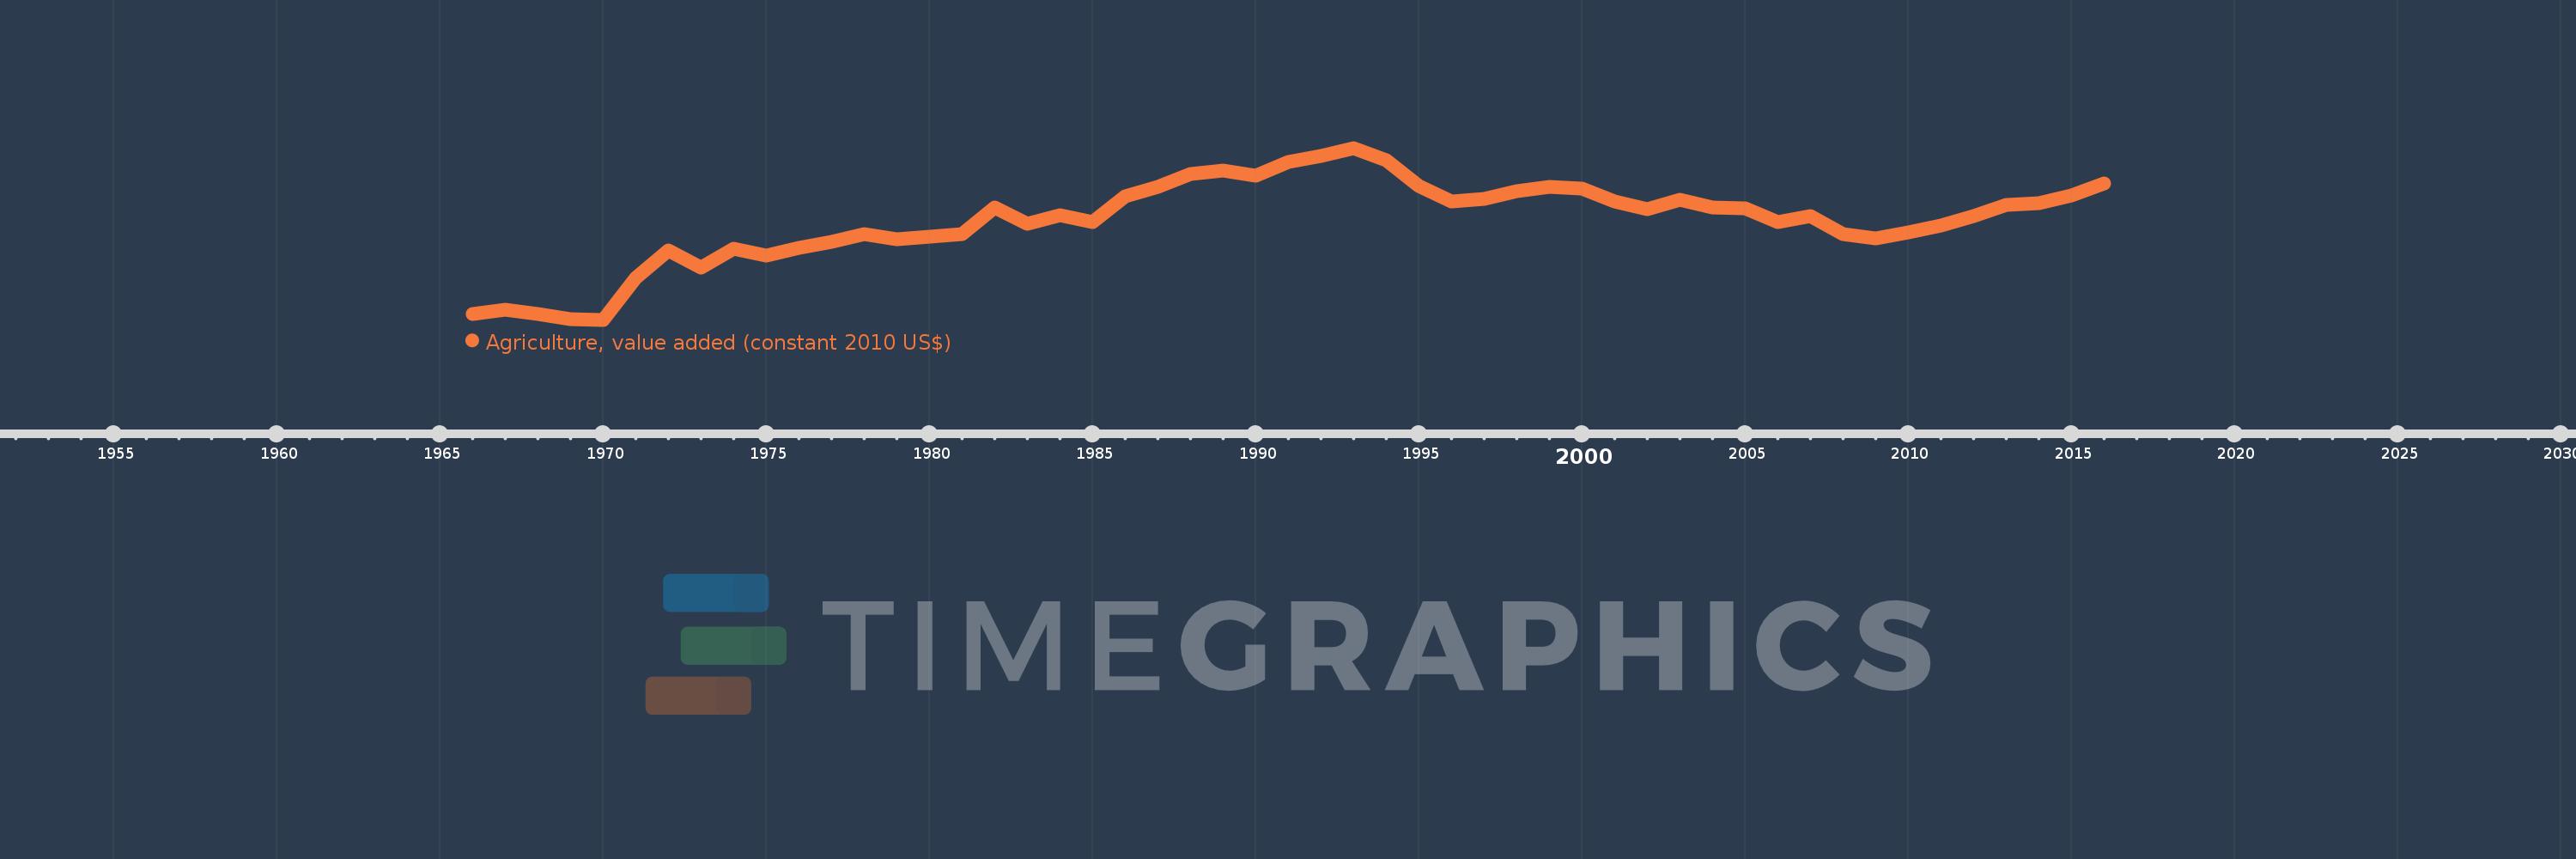
Agriculture, value added (constant 2010 US$)
2016,2015,2014,2013,2012,2011,2010,2009,2008,2007,2006,2005,2004,2003,2002,2001,2000,1999,1998,1997,1996,1995,1994,1993,1992,1991,1990,1989,1988,1987,1986,1985,1984,1983,1982,1981,1980,1979,1978,1977,1976,1975,1974,1973,1972,1971,1970,1969,1968,1967,1966
This statistics in other country:
AfghanistanAlbaniaAlgeriaAndorraAntigua and BarbudaArab WorldArgentinaArmeniaArubaAustraliaAustriaAzerbaijanBahamas, TheBahrainBangladeshBarbadosBelarusBelgiumBelizeBeninBermudaBhutanBoliviaBosnia and HerzegovinaBotswanaBrazilBrunei DarussalamBulgariaBurkina FasoBurundiCabo VerdeCambodiaCameroonCanadaCaribbean small statesCentral African RepublicCentral Europe and the BalticsChadChileChinaColombiaComorosCongo, Dem. Rep.Congo, Rep.Costa RicaCote d'IvoireCroatiaCubaCyprusCzech RepublicDenmarkDominicaDominican RepublicEarly-demographic dividendEast Asia & PacificEast Asia & Pacific (excluding high income)East Asia & Pacific (IDA & IBRD countries)EcuadorEgypt, Arab Rep.El SalvadorEquatorial GuineaEstoniaEthiopiaEuro areaEurope & Central AsiaEurope & Central Asia (excluding high income)Europe & Central Asia (IDA & IBRD countries)European UnionFijiFinlandFragile and conflict affected situationsFranceGabonGambia, TheGeorgiaGermanyGhanaGreeceGrenadaGuatemalaGuineaGuinea-BissauGuyanaHeavily indebted poor countries (HIPC)High incomeHondurasHong Kong SAR, ChinaHungaryIBRD onlyIcelandIDA & IBRD totalIDA blendIDA onlyIDA totalIndiaIndonesiaIran, Islamic Rep.IraqIrelandItalyJamaicaJapanJordanKazakhstanKenyaKiribatiKorea, Rep.KosovoKuwaitKyrgyz RepublicLao PDRLate-demographic dividendLatin America & Caribbean Latin America & Caribbean (excluding high income)Latin America & the Caribbean (IDA & IBRD countries)LatviaLeast developed countries: UN classificationLebanonLesothoLiberiaLithuaniaLow & middle incomeLow incomeLower middle incomeLuxembourgMacao SAR, ChinaMacedonia, FYRMadagascarMalawiMalaysiaMaldivesMaliMaltaMarshall IslandsMauritaniaMauritiusMexicoMicronesia, Fed. Sts.Middle East & North AfricaMiddle East & North Africa (excluding high income)Middle East & North Africa (IDA & IBRD countries)Middle incomeMoldovaMongoliaMontenegroMoroccoMozambiqueMyanmarNamibiaNepalNetherlandsNew ZealandNicaraguaNigerNigeriaNorth AmericaNorwayOECD membersOmanOther small statesPakistanPalauPanamaParaguayPeruPhilippinesPolandPortugalPost-demographic dividendPre-demographic dividendPuerto RicoQatarRomaniaRussian FederationRwandaSamoaSao Tome and PrincipeSaudi ArabiaSenegalSerbiaSeychellesSierra LeoneSingaporeSlovak RepublicSloveniaSmall statesSouth AfricaSouth AsiaSouth Asia (IDA & IBRD)SpainSri LankaSt. Kitts and NevisSt. LuciaSt. Vincent and the GrenadinesSub-Saharan Africa Sub-Saharan Africa (excluding high income)Sub-Saharan Africa (IDA & IBRD countries)SudanSurinameSwazilandSwedenSwitzerlandTajikistanTanzaniaThailandTimor-LesteTogoTongaTrinidad and TobagoTunisiaTurkeyTurkmenistanTuvaluUgandaUkraineUnited Arab EmiratesUnited KingdomUnited StatesUpper middle incomeUruguayUzbekistanVanuatuVenezuela, RBVietnamWest Bank and GazaWorldYemen, Rep.ZambiaZimbabwe Timeline:
This timeline shows a graph from 1966 to 2016 of Burundi. No data until 1965. Number of actual observations by date: 51.
Source name:
World Development Indicators
Source organization:
World Bank national accounts data, and OECD National Accounts data files.
Categories, topics:
Economy & Growth
Last updated:
apr 23, 2017
Indicators value changes by year
Minimum:
393.019 mln
jan 1, 1970
Maximum:
1.04 bln
jan 1, 1993
At the date of observation
Value
Absolute change
Change from previous value
jan 1, 1966
413.312 mln
+413.312 mln
0.0%
jan 1, 1967
431.736 mln
+18.424 mln
4.46%
jan 1, 1968
414.194 mln
-17.542 mln
-4.06%
jan 1, 1969
394.128 mln
-20.066 mln
-4.84%
jan 1, 1970
393.019 mln
-1.109 mln
-0.28%
jan 1, 1971
549.19 mln
+156.171 mln
39.74%
jan 1, 1972
654.898 mln
+105.708 mln
19.25%
jan 1, 1973
589.71 mln
-65.188 mln
-9.95%
jan 1, 1974
660.607 mln
+70.897 mln
12.02%
jan 1, 1975
634.167 mln
-26.44 mln
-4.0%
jan 1, 1976
663.406 mln
+29.239 mln
4.61%
jan 1, 1977
687.575 mln
+24.169 mln
3.64%
jan 1, 1978
715.738 mln
+28.163 mln
4.1%
jan 1, 1979
696.579 mln
-19.159 mln
-2.68%
jan 1, 1980
706.883 mln
+10.304 mln
1.48%
jan 1, 1981
715.918 mln
+9.035 mln
1.28%
jan 1, 1982
816.915 mln
+100.997 mln
14.11%
jan 1, 1983
754.935 mln
-61.98 mln
-7.59%
jan 1, 1984
788.091 mln
+33.155 mln
4.39%
jan 1, 1985
759.6 mln
-28.491 mln
-3.62%
jan 1, 1986
859.324 mln
+99.724 mln
13.13%
jan 1, 1987
894.801 mln
+35.476 mln
4.13%
jan 1, 1988
941.311 mln
+46.511 mln
5.2%
jan 1, 1989
956.247 mln
+14.936 mln
1.59%
jan 1, 1990
935.469 mln
-20.778 mln
-2.17%
jan 1, 1991
987.54 mln
+52.071 mln
5.57%
jan 1, 1992
1.009 bln
+21.032 mln
2.13%
jan 1, 1993
1.04 bln
+31.669 mln
3.14%
jan 1, 1994
994.678 mln
-45.563 mln
-4.38%
jan 1, 1995
897.896 mln
-96.782 mln
-9.73%
jan 1, 1996
837.108 mln
-60.788 mln
-6.77%
jan 1, 1997
849.749 mln
+12.64 mln
1.51%
jan 1, 1998
878.045 mln
+28.297 mln
3.33%
jan 1, 1999
894.992 mln
+16.946 mln
1.93%
jan 1, 2000
885.684 mln
-9.308 mln
-1.04%
jan 1, 2001
839.817 mln
-45.866 mln
-5.18%
jan 1, 2002
810.903 mln
-28.914 mln
-3.44%
jan 1, 2003
845.24 mln
+34.337 mln
4.23%
jan 1, 2004
815.539 mln
-29.7 mln
-3.51%
jan 1, 2005
813.587 mln
-1.952 mln
-0.24%
jan 1, 2006
760.213 mln
-53.375 mln
-6.56%
jan 1, 2007
784.146 mln
+23.933 mln
3.15%
jan 1, 2008
715.054 mln
-69.092 mln
-8.81%
jan 1, 2009
700.027 mln
-15.027 mln
-2.1%
jan 1, 2010
721.1 mln
+21.073 mln
3.01%
jan 1, 2011
749.309 mln
+28.209 mln
3.91%
jan 1, 2012
782.192 mln
+32.883 mln
4.39%
jan 1, 2013
824.685 mln
+42.493 mln
5.43%
jan 1, 2014
832.729 mln
+8.044 mln
0.98%
jan 1, 2015
860.619 mln
+27.89 mln
3.35%
jan 1, 2016
907.867 mln
+47.248 mln
5.49%
Ranking of countries by current statistics by years


Comments: