29
/
en
AIzaSyAYiBZKx7MnpbEhh9jyipgxe19OcubqV5w
April 1, 2024
138997
Germany
DEU
true
2
1
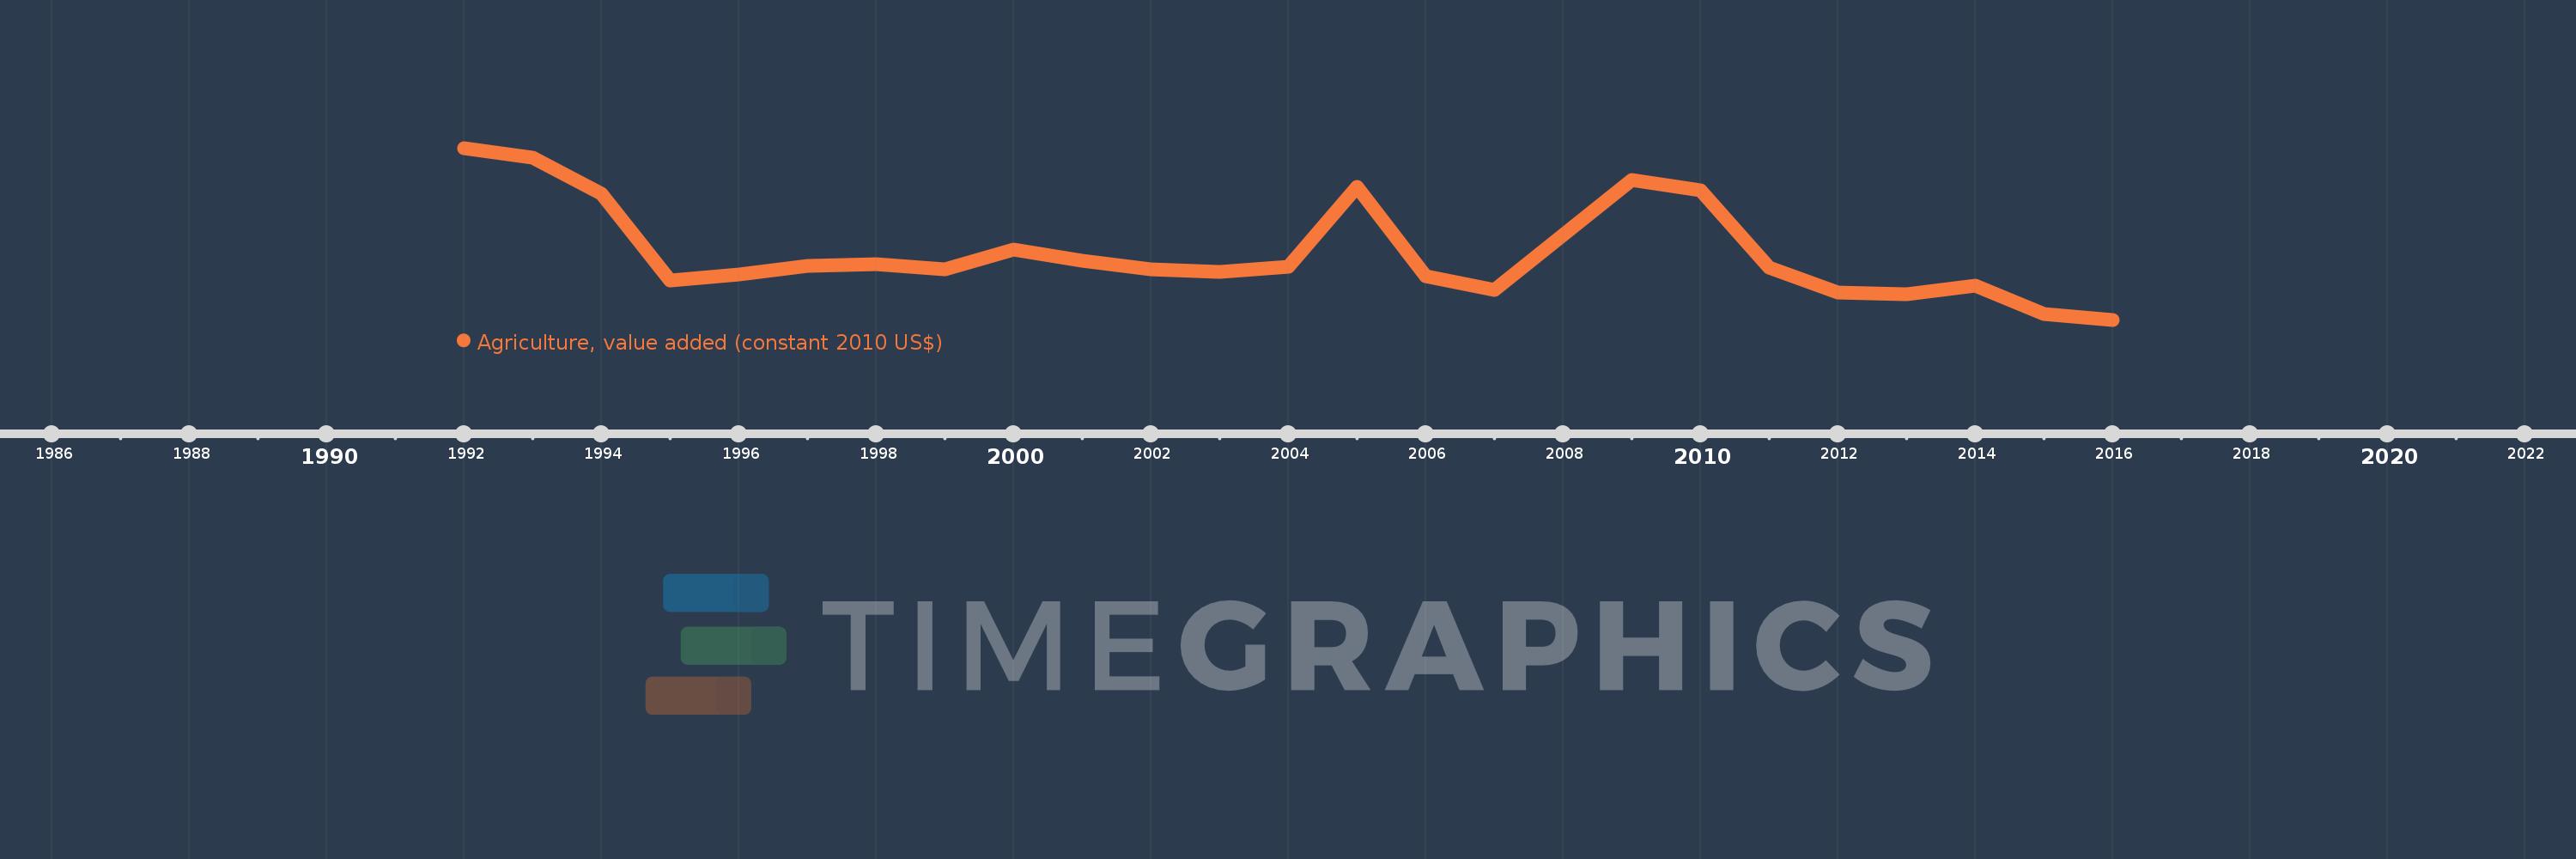
Agriculture, value added (constant 2010 US$)
2016,2015,2014,2013,2012,2011,2010,2009,2008,2007,2006,2005,2004,2003,2002,2001,2000,1999,1998,1997,1996,1995,1994,1993,1992
This statistics in other country:
AfghanistanAlbaniaAlgeriaAndorraAntigua and BarbudaArab WorldArgentinaArmeniaArubaAustraliaAustriaAzerbaijanBahamas, TheBahrainBangladeshBarbadosBelarusBelgiumBelizeBeninBermudaBhutanBoliviaBosnia and HerzegovinaBotswanaBrazilBrunei DarussalamBulgariaBurkina FasoBurundiCabo VerdeCambodiaCameroonCanadaCaribbean small statesCentral African RepublicCentral Europe and the BalticsChadChileChinaColombiaComorosCongo, Dem. Rep.Congo, Rep.Costa RicaCote d'IvoireCroatiaCubaCyprusCzech RepublicDenmarkDominicaDominican RepublicEarly-demographic dividendEast Asia & PacificEast Asia & Pacific (excluding high income)East Asia & Pacific (IDA & IBRD countries)EcuadorEgypt, Arab Rep.El SalvadorEquatorial GuineaEstoniaEthiopiaEuro areaEurope & Central AsiaEurope & Central Asia (excluding high income)Europe & Central Asia (IDA & IBRD countries)European UnionFijiFinlandFragile and conflict affected situationsFranceGabonGambia, TheGeorgiaGermanyGhanaGreeceGrenadaGuatemalaGuineaGuinea-BissauGuyanaHeavily indebted poor countries (HIPC)High incomeHondurasHong Kong SAR, ChinaHungaryIBRD onlyIcelandIDA & IBRD totalIDA blendIDA onlyIDA totalIndiaIndonesiaIran, Islamic Rep.IraqIrelandItalyJamaicaJapanJordanKazakhstanKenyaKiribatiKorea, Rep.KosovoKuwaitKyrgyz RepublicLao PDRLate-demographic dividendLatin America & Caribbean Latin America & Caribbean (excluding high income)Latin America & the Caribbean (IDA & IBRD countries)LatviaLeast developed countries: UN classificationLebanonLesothoLiberiaLithuaniaLow & middle incomeLow incomeLower middle incomeLuxembourgMacao SAR, ChinaMacedonia, FYRMadagascarMalawiMalaysiaMaldivesMaliMaltaMarshall IslandsMauritaniaMauritiusMexicoMicronesia, Fed. Sts.Middle East & North AfricaMiddle East & North Africa (excluding high income)Middle East & North Africa (IDA & IBRD countries)Middle incomeMoldovaMongoliaMontenegroMoroccoMozambiqueMyanmarNamibiaNepalNetherlandsNew ZealandNicaraguaNigerNigeriaNorth AmericaNorwayOECD membersOmanOther small statesPakistanPalauPanamaParaguayPeruPhilippinesPolandPortugalPost-demographic dividendPre-demographic dividendPuerto RicoQatarRomaniaRussian FederationRwandaSamoaSao Tome and PrincipeSaudi ArabiaSenegalSerbiaSeychellesSierra LeoneSingaporeSlovak RepublicSloveniaSmall statesSouth AfricaSouth AsiaSouth Asia (IDA & IBRD)SpainSri LankaSt. Kitts and NevisSt. LuciaSt. Vincent and the GrenadinesSub-Saharan Africa Sub-Saharan Africa (excluding high income)Sub-Saharan Africa (IDA & IBRD countries)SudanSurinameSwazilandSwedenSwitzerlandTajikistanTanzaniaThailandTimor-LesteTogoTongaTrinidad and TobagoTunisiaTurkeyTurkmenistanTuvaluUgandaUkraineUnited Arab EmiratesUnited KingdomUnited StatesUpper middle incomeUruguayUzbekistanVanuatuVenezuela, RBVietnamWest Bank and GazaWorldYemen, Rep.ZambiaZimbabwe Timeline:
This timeline shows a graph from 1992 to 2016 of Germany. No data until 1991. Number of actual observations by date: 25.
Source name:
World Development Indicators
Source organization:
World Bank national accounts data, and OECD National Accounts data files.
Categories, topics:
Economy & Growth
Last updated:
apr 23, 2017
Indicators value changes by year
Minimum:
17.317 bln
jan 1, 2016
Maximum:
33.177 bln
jan 1, 1992
At the date of observation
Value
Absolute change
Change from previous value
jan 1, 1992
33.177 bln
+33.177 bln
0.0%
jan 1, 1993
32.29 bln
-886.98 mln
-2.67%
jan 1, 1994
28.97 bln
-3.32 bln
-10.28%
jan 1, 1995
20.978 bln
-7.992 bln
-27.59%
jan 1, 1996
21.473 bln
+495.47 mln
2.36%
jan 1, 1997
22.281 bln
+807.351 mln
3.76%
jan 1, 1998
22.447 bln
+165.894 mln
0.74%
jan 1, 1999
21.94 bln
-506.53 mln
-2.26%
jan 1, 2000
23.796 bln
+1.856 bln
8.46%
jan 1, 2001
22.803 bln
-993.152 mln
-4.17%
jan 1, 2002
21.947 bln
-856.013 mln
-3.75%
jan 1, 2003
21.71 bln
-236.675 mln
-1.08%
jan 1, 2004
22.228 bln
+517.589 mln
2.38%
jan 1, 2005
29.578 bln
+7.35 bln
33.07%
jan 1, 2006
21.336 bln
-8.242 bln
-27.86%
jan 1, 2007
20.069 bln
-1.267 bln
-5.94%
jan 1, 2008
25.178 bln
+5.11 bln
25.46%
jan 1, 2009
30.239 bln
+5.061 bln
20.1%
jan 1, 2010
29.25 bln
-988.728 mln
-3.27%
jan 1, 2011
22.119 bln
-7.131 bln
-24.38%
jan 1, 2012
19.837 bln
-2.283 bln
-10.32%
jan 1, 2013
19.668 bln
-168.106 mln
-0.85%
jan 1, 2014
20.449 bln
+780.808 mln
3.97%
jan 1, 2015
17.888 bln
-2.561 bln
-12.53%
jan 1, 2016
17.317 bln
-570.675 mln
-3.19%
Ranking of countries by current statistics by years


Comments: