29
/
en
AIzaSyAYiBZKx7MnpbEhh9jyipgxe19OcubqV5w
April 1, 2024
278472
Uzbekistan
UZB
true
2
1
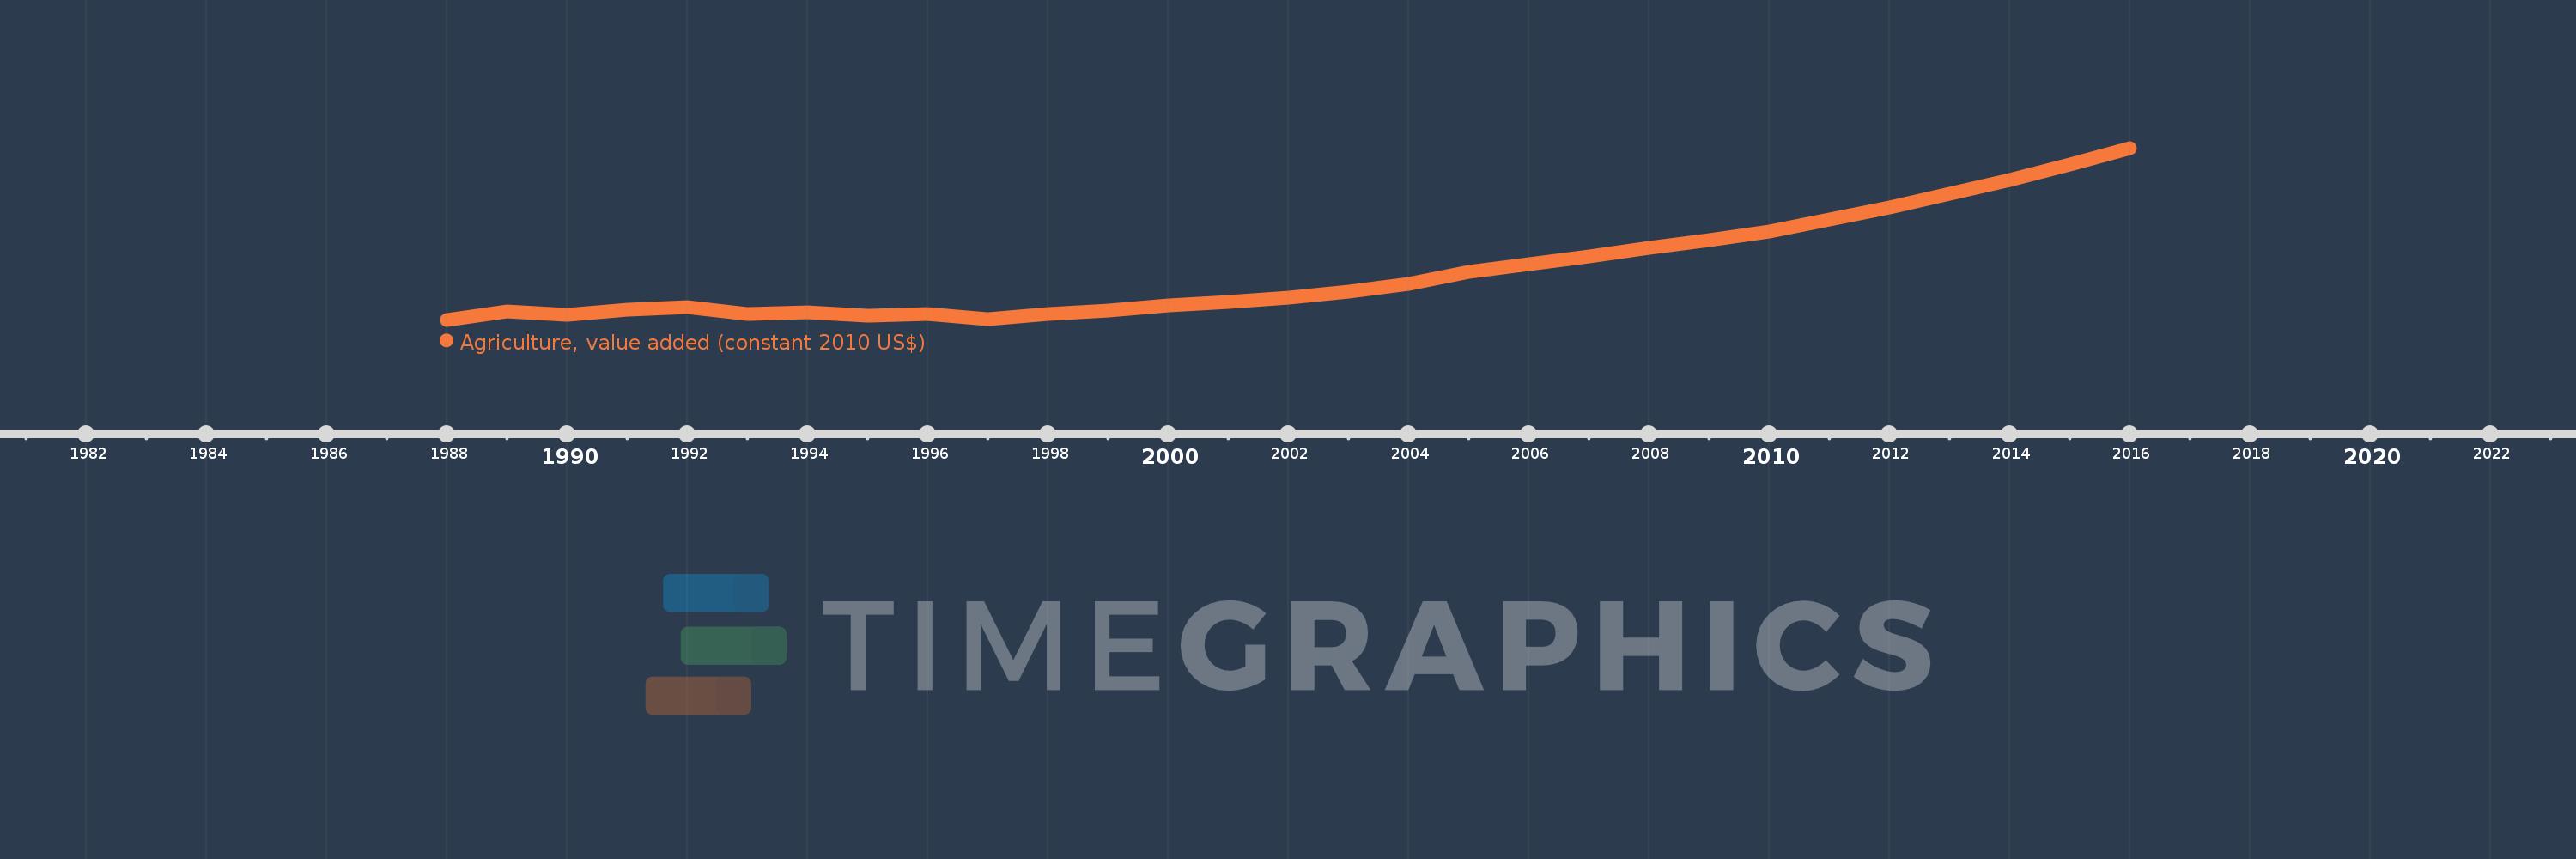
Agriculture, value added (constant 2010 US$)
2016,2015,2014,2013,2012,2011,2010,2009,2008,2007,2006,2005,2004,2003,2002,2001,2000,1999,1998,1997,1996,1995,1994,1993,1992,1991,1990,1989,1988
This statistics in other country:
AfghanistanAlbaniaAlgeriaAndorraAntigua and BarbudaArab WorldArgentinaArmeniaArubaAustraliaAustriaAzerbaijanBahamas, TheBahrainBangladeshBarbadosBelarusBelgiumBelizeBeninBermudaBhutanBoliviaBosnia and HerzegovinaBotswanaBrazilBrunei DarussalamBulgariaBurkina FasoBurundiCabo VerdeCambodiaCameroonCanadaCaribbean small statesCentral African RepublicCentral Europe and the BalticsChadChileChinaColombiaComorosCongo, Dem. Rep.Congo, Rep.Costa RicaCote d'IvoireCroatiaCubaCyprusCzech RepublicDenmarkDominicaDominican RepublicEarly-demographic dividendEast Asia & PacificEast Asia & Pacific (excluding high income)East Asia & Pacific (IDA & IBRD countries)EcuadorEgypt, Arab Rep.El SalvadorEquatorial GuineaEstoniaEthiopiaEuro areaEurope & Central AsiaEurope & Central Asia (excluding high income)Europe & Central Asia (IDA & IBRD countries)European UnionFijiFinlandFragile and conflict affected situationsFranceGabonGambia, TheGeorgiaGermanyGhanaGreeceGrenadaGuatemalaGuineaGuinea-BissauGuyanaHeavily indebted poor countries (HIPC)High incomeHondurasHong Kong SAR, ChinaHungaryIBRD onlyIcelandIDA & IBRD totalIDA blendIDA onlyIDA totalIndiaIndonesiaIran, Islamic Rep.IraqIrelandItalyJamaicaJapanJordanKazakhstanKenyaKiribatiKorea, Rep.KosovoKuwaitKyrgyz RepublicLao PDRLate-demographic dividendLatin America & Caribbean Latin America & Caribbean (excluding high income)Latin America & the Caribbean (IDA & IBRD countries)LatviaLeast developed countries: UN classificationLebanonLesothoLiberiaLithuaniaLow & middle incomeLow incomeLower middle incomeLuxembourgMacao SAR, ChinaMacedonia, FYRMadagascarMalawiMalaysiaMaldivesMaliMaltaMarshall IslandsMauritaniaMauritiusMexicoMicronesia, Fed. Sts.Middle East & North AfricaMiddle East & North Africa (excluding high income)Middle East & North Africa (IDA & IBRD countries)Middle incomeMoldovaMongoliaMontenegroMoroccoMozambiqueMyanmarNamibiaNepalNetherlandsNew ZealandNicaraguaNigerNigeriaNorth AmericaNorwayOECD membersOmanOther small statesPakistanPalauPanamaParaguayPeruPhilippinesPolandPortugalPost-demographic dividendPre-demographic dividendPuerto RicoQatarRomaniaRussian FederationRwandaSamoaSao Tome and PrincipeSaudi ArabiaSenegalSerbiaSeychellesSierra LeoneSingaporeSlovak RepublicSloveniaSmall statesSouth AfricaSouth AsiaSouth Asia (IDA & IBRD)SpainSri LankaSt. Kitts and NevisSt. LuciaSt. Vincent and the GrenadinesSub-Saharan Africa Sub-Saharan Africa (excluding high income)Sub-Saharan Africa (IDA & IBRD countries)SudanSurinameSwazilandSwedenSwitzerlandTajikistanTanzaniaThailandTimor-LesteTogoTongaTrinidad and TobagoTunisiaTurkeyTurkmenistanTuvaluUgandaUkraineUnited Arab EmiratesUnited KingdomUnited StatesUpper middle incomeUruguayUzbekistanVanuatuVenezuela, RBVietnamWest Bank and GazaWorldYemen, Rep.ZambiaZimbabwe Timeline:
This timeline shows a graph from 1988 to 2016 of Uzbekistan. No data until 1987. Number of actual observations by date: 29.
Source name:
World Development Indicators
Source organization:
World Bank national accounts data, and OECD National Accounts data files.
Categories, topics:
Economy & Growth
Last updated:
apr 23, 2017
Indicators value changes by year
Minimum:
3.213 bln
jan 1, 1988
Maximum:
9.843 bln
jan 1, 2016
At the date of observation
Value
Absolute change
Change from previous value
jan 1, 1988
3.213 bln
+3.213 bln
0.0%
jan 1, 1989
3.528 bln
+315.477 mln
9.82%
jan 1, 1990
3.406 bln
-121.941 mln
-3.46%
jan 1, 1991
3.604 bln
+198.155 mln
5.82%
jan 1, 1992
3.684 bln
+79.909 mln
2.22%
jan 1, 1993
3.446 bln
-238.34 mln
-6.47%
jan 1, 1994
3.497 bln
+51.687 mln
1.5%
jan 1, 1995
3.379 bln
-118.913 mln
-3.4%
jan 1, 1996
3.446 bln
+67.571 mln
2.0%
jan 1, 1997
3.25 bln
-196.428 mln
-5.7%
jan 1, 1998
3.438 bln
+188.482 mln
5.8%
jan 1, 1999
3.579 bln
+140.965 mln
4.1%
jan 1, 2000
3.776 bln
+196.852 mln
5.5%
jan 1, 2001
3.897 bln
+120.831 mln
3.2%
jan 1, 2002
4.057 bln
+159.769 mln
4.1%
jan 1, 2003
4.3 bln
+243.395 mln
6.0%
jan 1, 2004
4.592 bln
+292.398 mln
6.8%
jan 1, 2005
5.056 bln
+463.83 mln
10.1%
jan 1, 2006
5.37 bln
+313.485 mln
6.2%
jan 1, 2007
5.655 bln
+284.865 mln
5.31%
jan 1, 2008
5.999 bln
+344.928 mln
6.1%
jan 1, 2009
6.269 bln
+269.977 mln
4.5%
jan 1, 2010
6.627 bln
+357.359 mln
5.7%
jan 1, 2011
7.077 bln
+450.624 mln
6.8%
jan 1, 2012
7.545 bln
+467.111 mln
6.6%
jan 1, 2013
8.073 bln
+528.119 mln
7.0%
jan 1, 2014
8.622 bln
+548.942 mln
6.8%
jan 1, 2015
9.217 bln
+594.891 mln
6.9%
jan 1, 2016
9.843 bln
+626.722 mln
6.8%
Ranking of countries by current statistics by years


Comments: