29
/
en
AIzaSyAYiBZKx7MnpbEhh9jyipgxe19OcubqV5w
April 1, 2024
143980
Guatemala
GTM
true
2
1
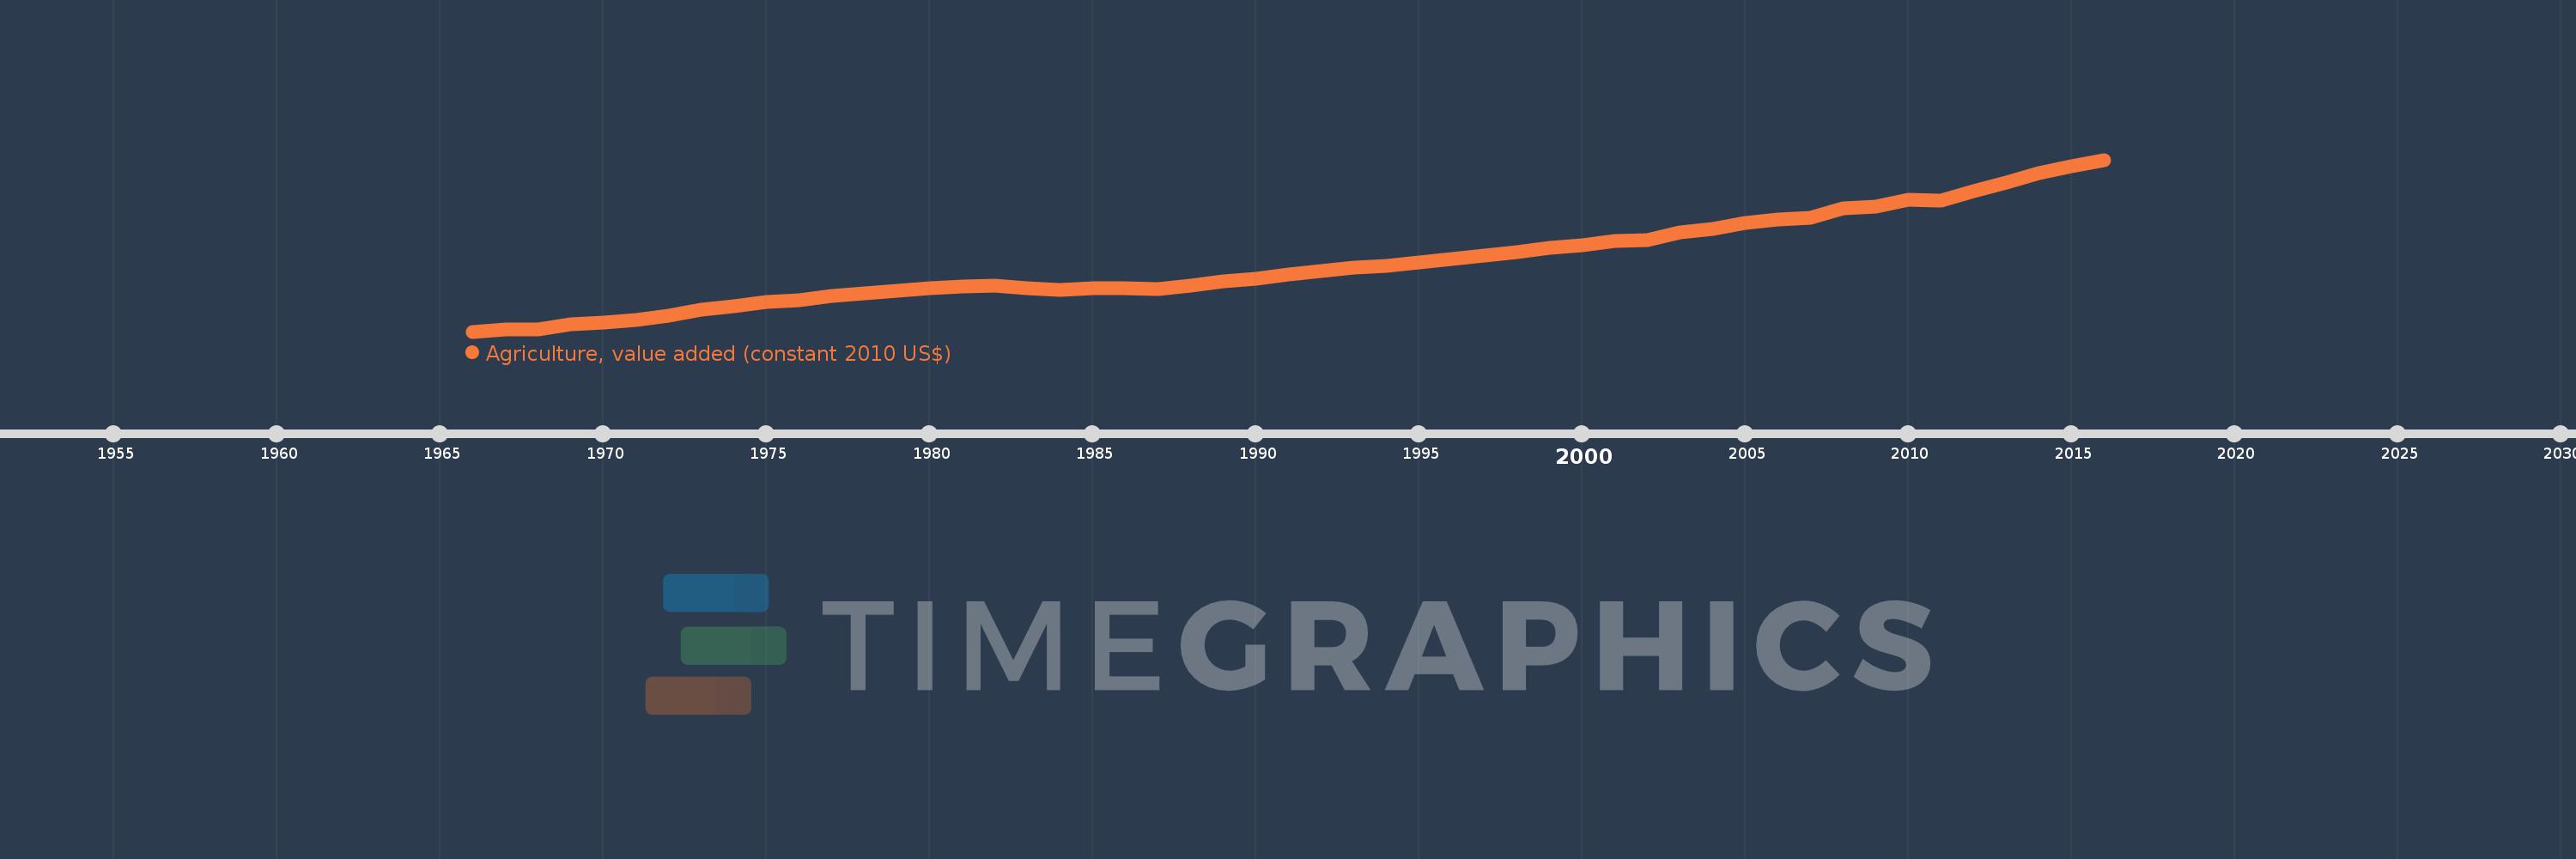
Agriculture, value added (constant 2010 US$)
2016,2015,2014,2013,2012,2011,2010,2009,2008,2007,2006,2005,2004,2003,2002,2001,2000,1999,1998,1997,1996,1995,1994,1993,1992,1991,1990,1989,1988,1987,1986,1985,1984,1983,1982,1981,1980,1979,1978,1977,1976,1975,1974,1973,1972,1971,1970,1969,1968,1967,1966
This statistics in other country:
AfghanistanAlbaniaAlgeriaAndorraAntigua and BarbudaArab WorldArgentinaArmeniaArubaAustraliaAustriaAzerbaijanBahamas, TheBahrainBangladeshBarbadosBelarusBelgiumBelizeBeninBermudaBhutanBoliviaBosnia and HerzegovinaBotswanaBrazilBrunei DarussalamBulgariaBurkina FasoBurundiCabo VerdeCambodiaCameroonCanadaCaribbean small statesCentral African RepublicCentral Europe and the BalticsChadChileChinaColombiaComorosCongo, Dem. Rep.Congo, Rep.Costa RicaCote d'IvoireCroatiaCubaCyprusCzech RepublicDenmarkDominicaDominican RepublicEarly-demographic dividendEast Asia & PacificEast Asia & Pacific (excluding high income)East Asia & Pacific (IDA & IBRD countries)EcuadorEgypt, Arab Rep.El SalvadorEquatorial GuineaEstoniaEthiopiaEuro areaEurope & Central AsiaEurope & Central Asia (excluding high income)Europe & Central Asia (IDA & IBRD countries)European UnionFijiFinlandFragile and conflict affected situationsFranceGabonGambia, TheGeorgiaGermanyGhanaGreeceGrenadaGuatemalaGuineaGuinea-BissauGuyanaHeavily indebted poor countries (HIPC)High incomeHondurasHong Kong SAR, ChinaHungaryIBRD onlyIcelandIDA & IBRD totalIDA blendIDA onlyIDA totalIndiaIndonesiaIran, Islamic Rep.IraqIrelandItalyJamaicaJapanJordanKazakhstanKenyaKiribatiKorea, Rep.KosovoKuwaitKyrgyz RepublicLao PDRLate-demographic dividendLatin America & Caribbean Latin America & Caribbean (excluding high income)Latin America & the Caribbean (IDA & IBRD countries)LatviaLeast developed countries: UN classificationLebanonLesothoLiberiaLithuaniaLow & middle incomeLow incomeLower middle incomeLuxembourgMacao SAR, ChinaMacedonia, FYRMadagascarMalawiMalaysiaMaldivesMaliMaltaMarshall IslandsMauritaniaMauritiusMexicoMicronesia, Fed. Sts.Middle East & North AfricaMiddle East & North Africa (excluding high income)Middle East & North Africa (IDA & IBRD countries)Middle incomeMoldovaMongoliaMontenegroMoroccoMozambiqueMyanmarNamibiaNepalNetherlandsNew ZealandNicaraguaNigerNigeriaNorth AmericaNorwayOECD membersOmanOther small statesPakistanPalauPanamaParaguayPeruPhilippinesPolandPortugalPost-demographic dividendPre-demographic dividendPuerto RicoQatarRomaniaRussian FederationRwandaSamoaSao Tome and PrincipeSaudi ArabiaSenegalSerbiaSeychellesSierra LeoneSingaporeSlovak RepublicSloveniaSmall statesSouth AfricaSouth AsiaSouth Asia (IDA & IBRD)SpainSri LankaSt. Kitts and NevisSt. LuciaSt. Vincent and the GrenadinesSub-Saharan Africa Sub-Saharan Africa (excluding high income)Sub-Saharan Africa (IDA & IBRD countries)SudanSurinameSwazilandSwedenSwitzerlandTajikistanTanzaniaThailandTimor-LesteTogoTongaTrinidad and TobagoTunisiaTurkeyTurkmenistanTuvaluUgandaUkraineUnited Arab EmiratesUnited KingdomUnited StatesUpper middle incomeUruguayUzbekistanVanuatuVenezuela, RBVietnamWest Bank and GazaWorldYemen, Rep.ZambiaZimbabwe Timeline:
This timeline shows a graph from 1966 to 2016 of Guatemala. No data until 1965. Number of actual observations by date: 51.
Source name:
World Development Indicators
Source organization:
World Bank national accounts data, and OECD National Accounts data files.
Categories, topics:
Economy & Growth
Last updated:
apr 23, 2017
Indicators value changes by year
Minimum:
1.181 bln
jan 1, 1966
Maximum:
5.62 bln
jan 1, 2016
At the date of observation
Value
Absolute change
Change from previous value
jan 1, 1966
1.181 bln
+1.181 bln
0.0%
jan 1, 1967
1.236 bln
+55.496 mln
4.7%
jan 1, 1968
1.238 bln
+1.213 mln
0.1%
jan 1, 1969
1.371 bln
+133.736 mln
10.81%
jan 1, 1970
1.404 bln
+32.448 mln
2.37%
jan 1, 1971
1.485 bln
+81.273 mln
5.79%
jan 1, 1972
1.59 bln
+104.927 mln
7.07%
jan 1, 1973
1.743 bln
+152.841 mln
9.61%
jan 1, 1974
1.835 bln
+92.19 mln
5.29%
jan 1, 1975
1.952 bln
+117.36 mln
6.4%
jan 1, 1976
2.001 bln
+48.824 mln
2.5%
jan 1, 1977
2.091 bln
+90.067 mln
4.5%
jan 1, 1978
2.173 bln
+81.576 mln
3.9%
jan 1, 1979
2.241 bln
+68.536 mln
3.15%
jan 1, 1980
2.305 bln
+63.684 mln
2.84%
jan 1, 1981
2.341 bln
+36.088 mln
1.57%
jan 1, 1982
2.37 bln
+28.506 mln
1.22%
jan 1, 1983
2.299 bln
-70.962 mln
-2.99%
jan 1, 1984
2.259 bln
-39.727 mln
-1.73%
jan 1, 1985
2.296 bln
+36.694 mln
1.62%
jan 1, 1986
2.302 bln
+6.065 mln
0.26%
jan 1, 1987
2.284 bln
-18.195 mln
-0.79%
jan 1, 1988
2.373 bln
+89.157 mln
3.9%
jan 1, 1989
2.479 bln
+106.746 mln
4.5%
jan 1, 1990
2.556 bln
+76.117 mln
3.07%
jan 1, 1991
2.66 bln
+104.623 mln
4.09%
jan 1, 1992
2.743 bln
+82.486 mln
3.1%
jan 1, 1993
2.825 bln
+81.879 mln
2.99%
jan 1, 1994
2.887 bln
+62.285 mln
2.21%
jan 1, 1995
2.958 bln
+70.692 mln
2.45%
jan 1, 1996
3.061 bln
+103.695 mln
3.51%
jan 1, 1997
3.139 bln
+78.195 mln
2.55%
jan 1, 1998
3.232 bln
+92.148 mln
2.94%
jan 1, 1999
3.352 bln
+120.35 mln
3.72%
jan 1, 2000
3.422 bln
+70.509 mln
2.1%
jan 1, 2001
3.511 bln
+88.859 mln
2.6%
jan 1, 2002
3.552 bln
+40.899 mln
1.16%
jan 1, 2003
3.742 bln
+190.219 mln
5.36%
jan 1, 2004
3.836 bln
+93.938 mln
2.51%
jan 1, 2005
3.996 bln
+159.234 mln
4.15%
jan 1, 2006
4.081 bln
+84.992 mln
2.13%
jan 1, 2007
4.132 bln
+51.082 mln
1.25%
jan 1, 2008
4.375 bln
+242.892 mln
5.88%
jan 1, 2009
4.413 bln
+38.732 mln
0.89%
jan 1, 2010
4.581 bln
+167.89 mln
3.8%
jan 1, 2011
4.57 bln
-11.448 mln
-0.25%
jan 1, 2012
4.799 bln
+229.602 mln
5.02%
jan 1, 2013
5.036 bln
+237.059 mln
4.94%
jan 1, 2014
5.275 bln
+238.977 mln
4.75%
jan 1, 2015
5.443 bln
+167.248 mln
3.17%
jan 1, 2016
5.62 bln
+177.076 mln
3.25%
Ranking of countries by current statistics by years


Comments: