29
/
en
AIzaSyAYiBZKx7MnpbEhh9jyipgxe19OcubqV5w
April 1, 2024
116624
Cyprus
CYP
true
2
1
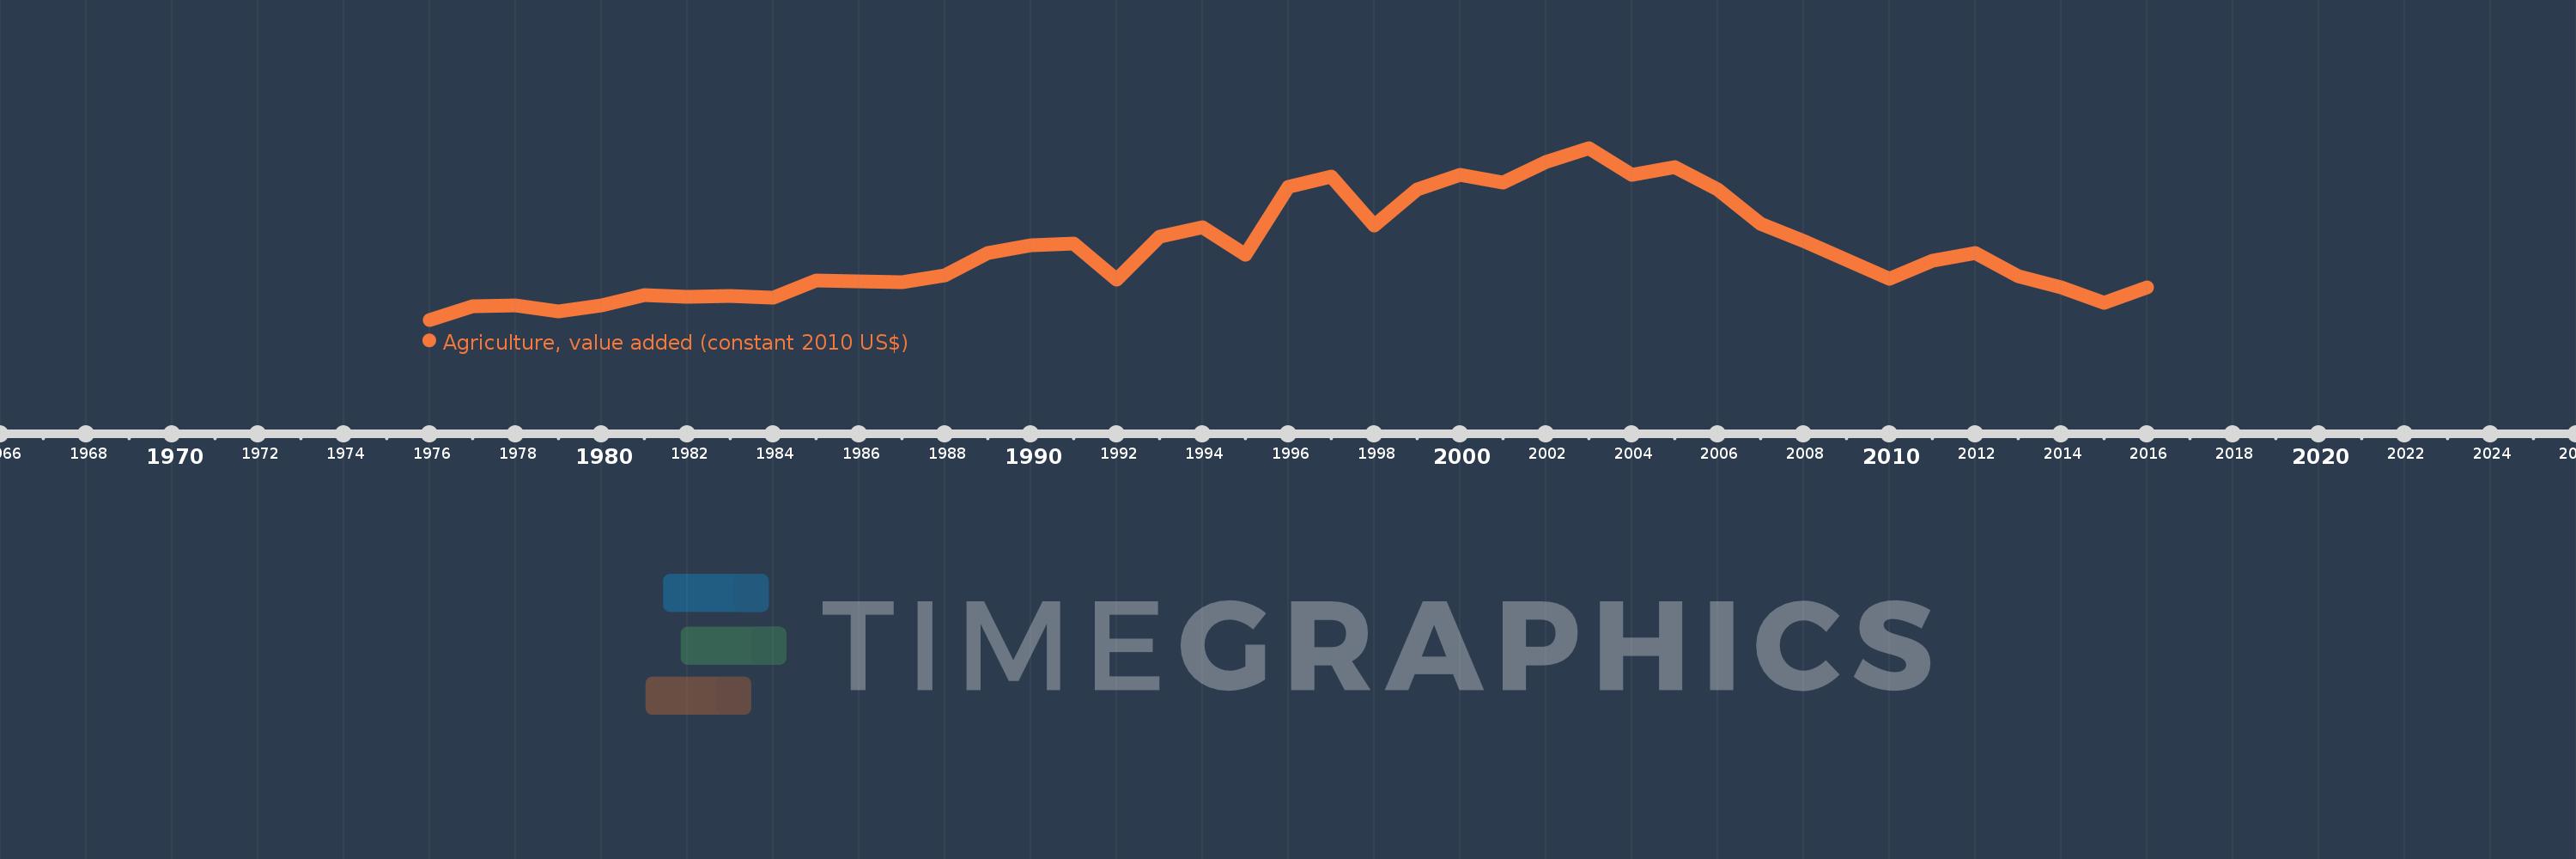
Agriculture, value added (constant 2010 US$)
2016,2015,2014,2013,2012,2011,2010,2009,2008,2007,2006,2005,2004,2003,2002,2001,2000,1999,1998,1997,1996,1995,1994,1993,1992,1991,1990,1989,1988,1987,1986,1985,1984,1983,1982,1981,1980,1979,1978,1977,1976
This statistics in other country:
AfghanistanAlbaniaAlgeriaAndorraAntigua and BarbudaArab WorldArgentinaArmeniaArubaAustraliaAustriaAzerbaijanBahamas, TheBahrainBangladeshBarbadosBelarusBelgiumBelizeBeninBermudaBhutanBoliviaBosnia and HerzegovinaBotswanaBrazilBrunei DarussalamBulgariaBurkina FasoBurundiCabo VerdeCambodiaCameroonCanadaCaribbean small statesCentral African RepublicCentral Europe and the BalticsChadChileChinaColombiaComorosCongo, Dem. Rep.Congo, Rep.Costa RicaCote d'IvoireCroatiaCubaCyprusCzech RepublicDenmarkDominicaDominican RepublicEarly-demographic dividendEast Asia & PacificEast Asia & Pacific (excluding high income)East Asia & Pacific (IDA & IBRD countries)EcuadorEgypt, Arab Rep.El SalvadorEquatorial GuineaEstoniaEthiopiaEuro areaEurope & Central AsiaEurope & Central Asia (excluding high income)Europe & Central Asia (IDA & IBRD countries)European UnionFijiFinlandFragile and conflict affected situationsFranceGabonGambia, TheGeorgiaGermanyGhanaGreeceGrenadaGuatemalaGuineaGuinea-BissauGuyanaHeavily indebted poor countries (HIPC)High incomeHondurasHong Kong SAR, ChinaHungaryIBRD onlyIcelandIDA & IBRD totalIDA blendIDA onlyIDA totalIndiaIndonesiaIran, Islamic Rep.IraqIrelandItalyJamaicaJapanJordanKazakhstanKenyaKiribatiKorea, Rep.KosovoKuwaitKyrgyz RepublicLao PDRLate-demographic dividendLatin America & Caribbean Latin America & Caribbean (excluding high income)Latin America & the Caribbean (IDA & IBRD countries)LatviaLeast developed countries: UN classificationLebanonLesothoLiberiaLithuaniaLow & middle incomeLow incomeLower middle incomeLuxembourgMacao SAR, ChinaMacedonia, FYRMadagascarMalawiMalaysiaMaldivesMaliMaltaMarshall IslandsMauritaniaMauritiusMexicoMicronesia, Fed. Sts.Middle East & North AfricaMiddle East & North Africa (excluding high income)Middle East & North Africa (IDA & IBRD countries)Middle incomeMoldovaMongoliaMontenegroMoroccoMozambiqueMyanmarNamibiaNepalNetherlandsNew ZealandNicaraguaNigerNigeriaNorth AmericaNorwayOECD membersOmanOther small statesPakistanPalauPanamaParaguayPeruPhilippinesPolandPortugalPost-demographic dividendPre-demographic dividendPuerto RicoQatarRomaniaRussian FederationRwandaSamoaSao Tome and PrincipeSaudi ArabiaSenegalSerbiaSeychellesSierra LeoneSingaporeSlovak RepublicSloveniaSmall statesSouth AfricaSouth AsiaSouth Asia (IDA & IBRD)SpainSri LankaSt. Kitts and NevisSt. LuciaSt. Vincent and the GrenadinesSub-Saharan Africa Sub-Saharan Africa (excluding high income)Sub-Saharan Africa (IDA & IBRD countries)SudanSurinameSwazilandSwedenSwitzerlandTajikistanTanzaniaThailandTimor-LesteTogoTongaTrinidad and TobagoTunisiaTurkeyTurkmenistanTuvaluUgandaUkraineUnited Arab EmiratesUnited KingdomUnited StatesUpper middle incomeUruguayUzbekistanVanuatuVenezuela, RBVietnamWest Bank and GazaWorldYemen, Rep.ZambiaZimbabwe Timeline:
This timeline shows a graph from 1976 to 2016 of Cyprus. No data until 1975. Number of actual observations by date: 41.
Source name:
World Development Indicators
Source organization:
World Bank national accounts data, and OECD National Accounts data files.
Categories, topics:
Economy & Growth
Last updated:
apr 23, 2017
Indicators value changes by year
Minimum:
394.074 mln
jan 1, 1976
Maximum:
811.052 mln
jan 1, 2003
At the date of observation
Value
Absolute change
Change from previous value
jan 1, 1976
394.074 mln
+394.074 mln
0.0%
jan 1, 1977
427.425 mln
+33.351 mln
8.46%
jan 1, 1978
427.864 mln
+438.766K
0.1%
jan 1, 1979
413.821 mln
-14.043 mln
-3.28%
jan 1, 1980
428.741 mln
+14.92 mln
3.61%
jan 1, 1981
452.877 mln
+24.136 mln
5.63%
jan 1, 1982
449.806 mln
-3.072 mln
-0.68%
jan 1, 1983
451.561 mln
+1.755 mln
0.39%
jan 1, 1984
446.734 mln
-4.827 mln
-1.07%
jan 1, 1985
488.423 mln
+41.689 mln
9.33%
jan 1, 1986
487.106 mln
-1.316 mln
-0.27%
jan 1, 1987
484.473 mln
-2.633 mln
-0.54%
jan 1, 1988
501.149 mln
+16.676 mln
3.44%
jan 1, 1989
556.003 mln
+54.854 mln
10.95%
jan 1, 1990
574.435 mln
+18.431 mln
3.31%
jan 1, 1991
578.823 mln
+4.388 mln
0.76%
jan 1, 1992
491.495 mln
-87.328 mln
-15.09%
jan 1, 1993
596.376 mln
+104.881 mln
21.34%
jan 1, 1994
618.757 mln
+22.381 mln
3.75%
jan 1, 1995
551.176 mln
-67.58 mln
-10.92%
jan 1, 1996
717.117 mln
+165.94 mln
30.11%
jan 1, 1997
741.982 mln
+24.865 mln
3.47%
jan 1, 1998
623.355 mln
-118.627 mln
-15.99%
jan 1, 1999
710.728 mln
+87.373 mln
14.02%
jan 1, 2000
745.09 mln
+34.362 mln
4.83%
jan 1, 2001
727.132 mln
-17.958 mln
-2.41%
jan 1, 2002
777.38 mln
+50.248 mln
6.91%
jan 1, 2003
811.052 mln
+33.672 mln
4.33%
jan 1, 2004
745.263 mln
-65.789 mln
-8.11%
jan 1, 2005
764.43 mln
+19.167 mln
2.57%
jan 1, 2006
711.246 mln
-53.184 mln
-6.96%
jan 1, 2007
627.153 mln
-84.092 mln
-11.82%
jan 1, 2008
586.057 mln
-41.097 mln
-6.55%
jan 1, 2009
538.917 mln
-47.14 mln
-8.04%
jan 1, 2010
492.813 mln
-46.104 mln
-8.55%
jan 1, 2011
537.881 mln
+45.068 mln
9.15%
jan 1, 2012
555.666 mln
+17.785 mln
3.31%
jan 1, 2013
498.856 mln
-56.81 mln
-10.22%
jan 1, 2014
472.092 mln
-26.765 mln
-5.37%
jan 1, 2015
434.794 mln
-37.298 mln
-7.9%
jan 1, 2016
473.128 mln
+38.334 mln
8.82%
Ranking of countries by current statistics by years


Comments: