29
/
en
AIzaSyAYiBZKx7MnpbEhh9jyipgxe19OcubqV5w
April 1, 2024
259211
Tajikistan
TJK
true
2
1
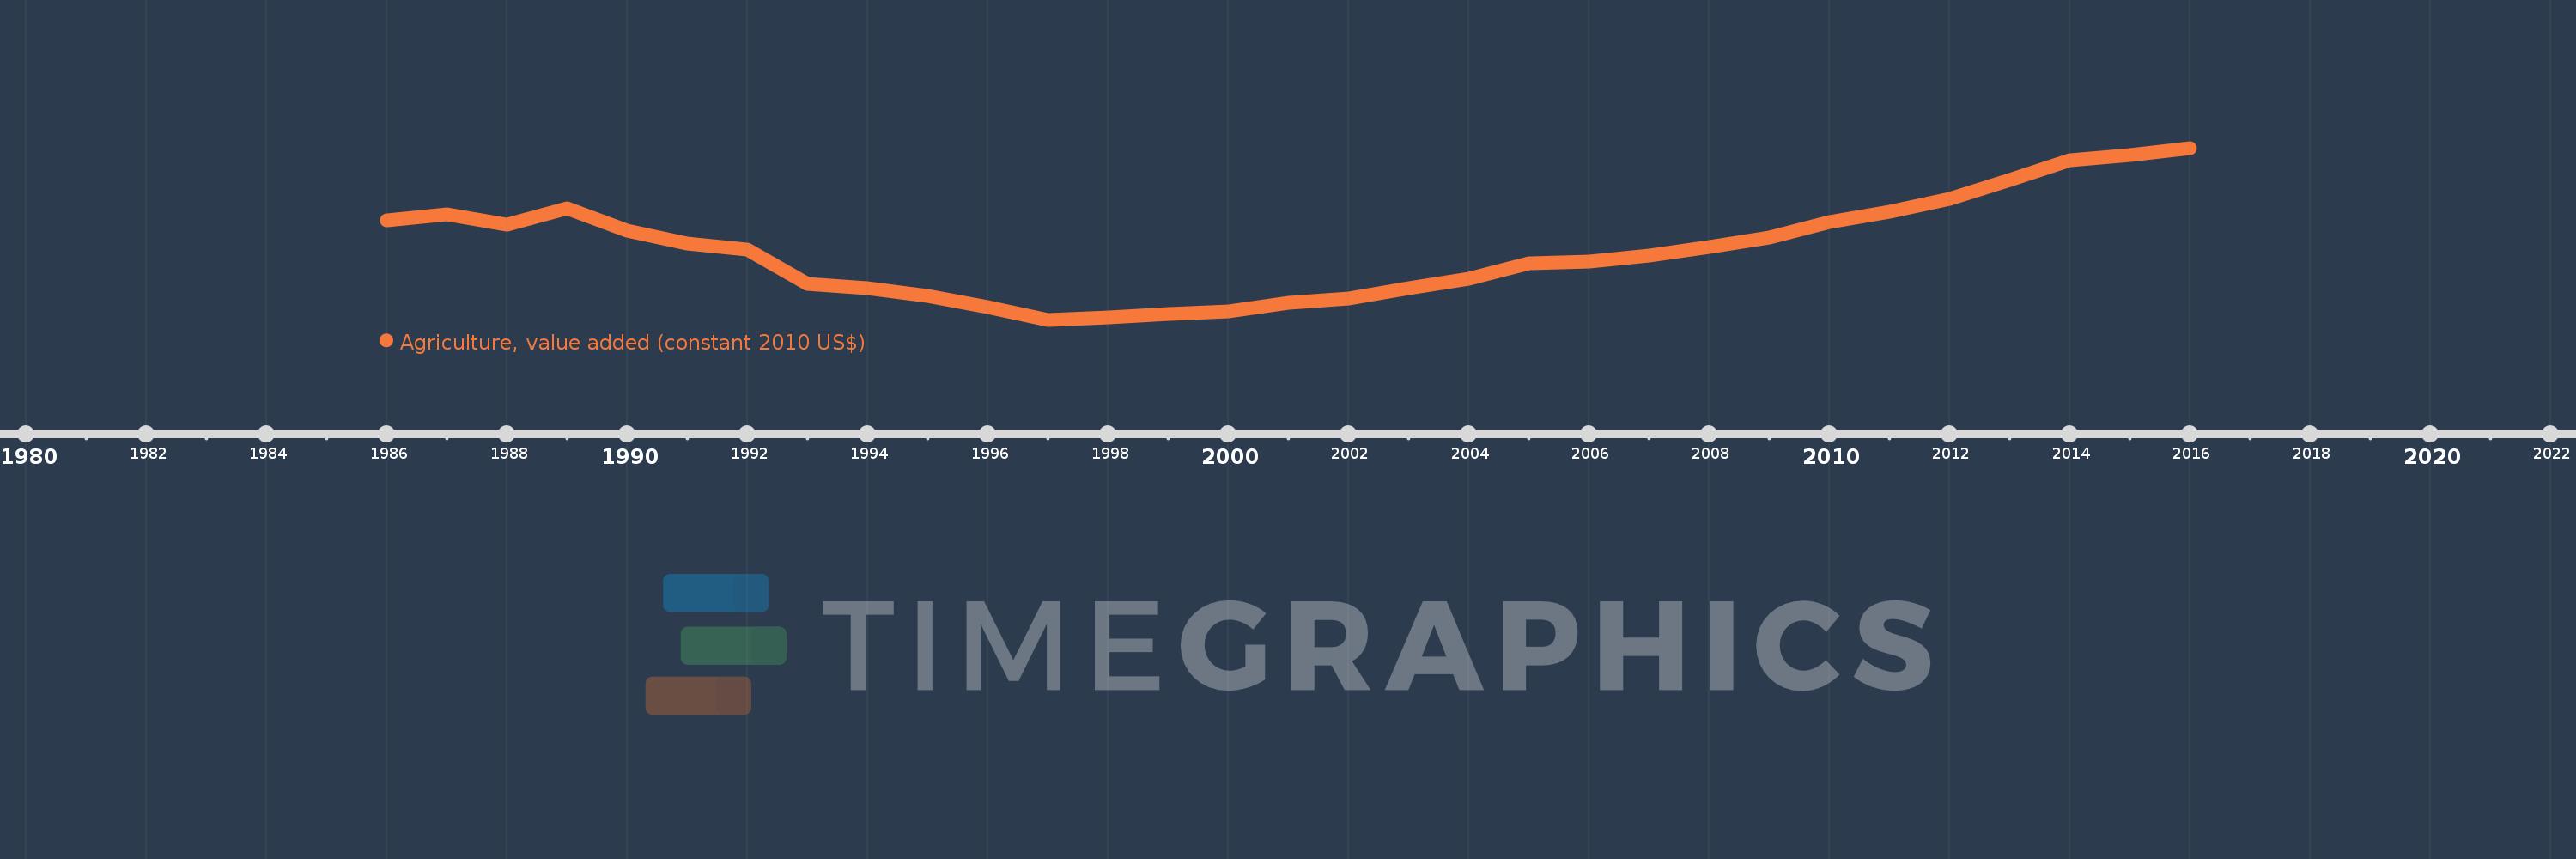
Agriculture, value added (constant 2010 US$)
2016,2015,2014,2013,2012,2011,2010,2009,2008,2007,2006,2005,2004,2003,2002,2001,2000,1999,1998,1997,1996,1995,1994,1993,1992,1991,1990,1989,1988,1987,1986
This statistics in other country:
AfghanistanAlbaniaAlgeriaAndorraAntigua and BarbudaArab WorldArgentinaArmeniaArubaAustraliaAustriaAzerbaijanBahamas, TheBahrainBangladeshBarbadosBelarusBelgiumBelizeBeninBermudaBhutanBoliviaBosnia and HerzegovinaBotswanaBrazilBrunei DarussalamBulgariaBurkina FasoBurundiCabo VerdeCambodiaCameroonCanadaCaribbean small statesCentral African RepublicCentral Europe and the BalticsChadChileChinaColombiaComorosCongo, Dem. Rep.Congo, Rep.Costa RicaCote d'IvoireCroatiaCubaCyprusCzech RepublicDenmarkDominicaDominican RepublicEarly-demographic dividendEast Asia & PacificEast Asia & Pacific (excluding high income)East Asia & Pacific (IDA & IBRD countries)EcuadorEgypt, Arab Rep.El SalvadorEquatorial GuineaEstoniaEthiopiaEuro areaEurope & Central AsiaEurope & Central Asia (excluding high income)Europe & Central Asia (IDA & IBRD countries)European UnionFijiFinlandFragile and conflict affected situationsFranceGabonGambia, TheGeorgiaGermanyGhanaGreeceGrenadaGuatemalaGuineaGuinea-BissauGuyanaHeavily indebted poor countries (HIPC)High incomeHondurasHong Kong SAR, ChinaHungaryIBRD onlyIcelandIDA & IBRD totalIDA blendIDA onlyIDA totalIndiaIndonesiaIran, Islamic Rep.IraqIrelandItalyJamaicaJapanJordanKazakhstanKenyaKiribatiKorea, Rep.KosovoKuwaitKyrgyz RepublicLao PDRLate-demographic dividendLatin America & Caribbean Latin America & Caribbean (excluding high income)Latin America & the Caribbean (IDA & IBRD countries)LatviaLeast developed countries: UN classificationLebanonLesothoLiberiaLithuaniaLow & middle incomeLow incomeLower middle incomeLuxembourgMacao SAR, ChinaMacedonia, FYRMadagascarMalawiMalaysiaMaldivesMaliMaltaMarshall IslandsMauritaniaMauritiusMexicoMicronesia, Fed. Sts.Middle East & North AfricaMiddle East & North Africa (excluding high income)Middle East & North Africa (IDA & IBRD countries)Middle incomeMoldovaMongoliaMontenegroMoroccoMozambiqueMyanmarNamibiaNepalNetherlandsNew ZealandNicaraguaNigerNigeriaNorth AmericaNorwayOECD membersOmanOther small statesPakistanPalauPanamaParaguayPeruPhilippinesPolandPortugalPost-demographic dividendPre-demographic dividendPuerto RicoQatarRomaniaRussian FederationRwandaSamoaSao Tome and PrincipeSaudi ArabiaSenegalSerbiaSeychellesSierra LeoneSingaporeSlovak RepublicSloveniaSmall statesSouth AfricaSouth AsiaSouth Asia (IDA & IBRD)SpainSri LankaSt. Kitts and NevisSt. LuciaSt. Vincent and the GrenadinesSub-Saharan Africa Sub-Saharan Africa (excluding high income)Sub-Saharan Africa (IDA & IBRD countries)SudanSurinameSwazilandSwedenSwitzerlandTajikistanTanzaniaThailandTimor-LesteTogoTongaTrinidad and TobagoTunisiaTurkeyTurkmenistanTuvaluUgandaUkraineUnited Arab EmiratesUnited KingdomUnited StatesUpper middle incomeUruguayUzbekistanVanuatuVenezuela, RBVietnamWest Bank and GazaWorldYemen, Rep.ZambiaZimbabwe Timeline:
This timeline shows a graph from 1986 to 2016 of Tajikistan. No data until 1985. Number of actual observations by date: 31.
Source name:
World Development Indicators
Source organization:
World Bank national accounts data, and OECD National Accounts data files.
Categories, topics:
Economy & Growth
Last updated:
apr 23, 2017
Indicators value changes by year
Minimum:
389.379 mln
jan 1, 1997
Maximum:
1.528 bln
jan 1, 2016
At the date of observation
Value
Absolute change
Change from previous value
jan 1, 1986
1.046 bln
+1.046 bln
0.0%
jan 1, 1987
1.087 bln
+40.806 mln
3.9%
jan 1, 1988
1.018 bln
-69.576 mln
-6.4%
jan 1, 1989
1.128 bln
+110.912 mln
10.9%
jan 1, 1990
980.627 mln
-147.828 mln
-13.1%
jan 1, 1991
891.39 mln
-89.237 mln
-9.1%
jan 1, 1992
852.169 mln
-39.221 mln
-4.4%
jan 1, 1993
624.64 mln
-227.529 mln
-26.7%
jan 1, 1994
597.156 mln
-27.484 mln
-4.4%
jan 1, 1995
546.995 mln
-50.161 mln
-8.4%
jan 1, 1996
473.697 mln
-73.297 mln
-13.4%
jan 1, 1997
389.379 mln
-84.318 mln
-17.8%
jan 1, 1998
403.397 mln
+14.018 mln
3.6%
jan 1, 1999
428.811 mln
+25.414 mln
6.3%
jan 1, 2000
442.104 mln
+13.293 mln
3.1%
jan 1, 2001
498.989 mln
+56.885 mln
12.87%
jan 1, 2002
531.992 mln
+33.003 mln
6.61%
jan 1, 2003
599.555 mln
+67.563 mln
12.7%
jan 1, 2004
661.908 mln
+62.354 mln
10.4%
jan 1, 2005
763.18 mln
+101.272 mln
15.3%
jan 1, 2006
773.865 mln
+10.684 mln
1.4%
jan 1, 2007
815.653 mln
+41.789 mln
5.4%
jan 1, 2008
868.671 mln
+53.017 mln
6.5%
jan 1, 2009
936.427 mln
+67.756 mln
7.8%
jan 1, 2010
1.035 bln
+98.325 mln
10.5%
jan 1, 2011
1.105 bln
+70.363 mln
6.8%
jan 1, 2012
1.192 bln
+87.304 mln
7.9%
jan 1, 2013
1.316 bln
+124.012 mln
10.4%
jan 1, 2014
1.448 bln
+131.643 mln
10.0%
jan 1, 2015
1.48 bln
+32.147 mln
2.22%
jan 1, 2016
1.528 bln
+47.368 mln
3.2%
Ranking of countries by current statistics by years


Comments: