29
/
en
AIzaSyAYiBZKx7MnpbEhh9jyipgxe19OcubqV5w
April 1, 2024
286826
Zimbabwe
ZWE
true
2
1
Agriculture, value added (constant 2010 US$)
2016,2015,2014,2013,2012,2011,2010,2009,2008,2007,2006,2005,2004,2003,2002,2001,2000,1999,1998,1997,1996,1995,1994,1993,1992,1991,1990,1989,1988,1987,1986,1985,1984,1983,1982,1981,1980,1979,1978,1977,1976,1975,1974,1973,1972,1971,1970
This statistics in other country:
AfghanistanAlbaniaAlgeriaAndorraAntigua and BarbudaArab WorldArgentinaArmeniaArubaAustraliaAustriaAzerbaijanBahamas, TheBahrainBangladeshBarbadosBelarusBelgiumBelizeBeninBermudaBhutanBoliviaBosnia and HerzegovinaBotswanaBrazilBrunei DarussalamBulgariaBurkina FasoBurundiCabo VerdeCambodiaCameroonCanadaCaribbean small statesCentral African RepublicCentral Europe and the BalticsChadChileChinaColombiaComorosCongo, Dem. Rep.Congo, Rep.Costa RicaCote d'IvoireCroatiaCubaCyprusCzech RepublicDenmarkDominicaDominican RepublicEarly-demographic dividendEast Asia & PacificEast Asia & Pacific (excluding high income)East Asia & Pacific (IDA & IBRD countries)EcuadorEgypt, Arab Rep.El SalvadorEquatorial GuineaEstoniaEthiopiaEuro areaEurope & Central AsiaEurope & Central Asia (excluding high income)Europe & Central Asia (IDA & IBRD countries)European UnionFijiFinlandFragile and conflict affected situationsFranceGabonGambia, TheGeorgiaGermanyGhanaGreeceGrenadaGuatemalaGuineaGuinea-BissauGuyanaHeavily indebted poor countries (HIPC)High incomeHondurasHong Kong SAR, ChinaHungaryIBRD onlyIcelandIDA & IBRD totalIDA blendIDA onlyIDA totalIndiaIndonesiaIran, Islamic Rep.IraqIrelandItalyJamaicaJapanJordanKazakhstanKenyaKiribatiKorea, Rep.KosovoKuwaitKyrgyz RepublicLao PDRLate-demographic dividendLatin America & Caribbean Latin America & Caribbean (excluding high income)Latin America & the Caribbean (IDA & IBRD countries)LatviaLeast developed countries: UN classificationLebanonLesothoLiberiaLithuaniaLow & middle incomeLow incomeLower middle incomeLuxembourgMacao SAR, ChinaMacedonia, FYRMadagascarMalawiMalaysiaMaldivesMaliMaltaMarshall IslandsMauritaniaMauritiusMexicoMicronesia, Fed. Sts.Middle East & North AfricaMiddle East & North Africa (excluding high income)Middle East & North Africa (IDA & IBRD countries)Middle incomeMoldovaMongoliaMontenegroMoroccoMozambiqueMyanmarNamibiaNepalNetherlandsNew ZealandNicaraguaNigerNigeriaNorth AmericaNorwayOECD membersOmanOther small statesPakistanPalauPanamaParaguayPeruPhilippinesPolandPortugalPost-demographic dividendPre-demographic dividendPuerto RicoQatarRomaniaRussian FederationRwandaSamoaSao Tome and PrincipeSaudi ArabiaSenegalSerbiaSeychellesSierra LeoneSingaporeSlovak RepublicSloveniaSmall statesSouth AfricaSouth AsiaSouth Asia (IDA & IBRD)SpainSri LankaSt. Kitts and NevisSt. LuciaSt. Vincent and the GrenadinesSub-Saharan Africa Sub-Saharan Africa (excluding high income)Sub-Saharan Africa (IDA & IBRD countries)SudanSurinameSwazilandSwedenSwitzerlandTajikistanTanzaniaThailandTimor-LesteTogoTongaTrinidad and TobagoTunisiaTurkeyTurkmenistanTuvaluUgandaUkraineUnited Arab EmiratesUnited KingdomUnited StatesUpper middle incomeUruguayUzbekistanVanuatuVenezuela, RBVietnamWest Bank and GazaWorldYemen, Rep.ZambiaZimbabwe Timeline:
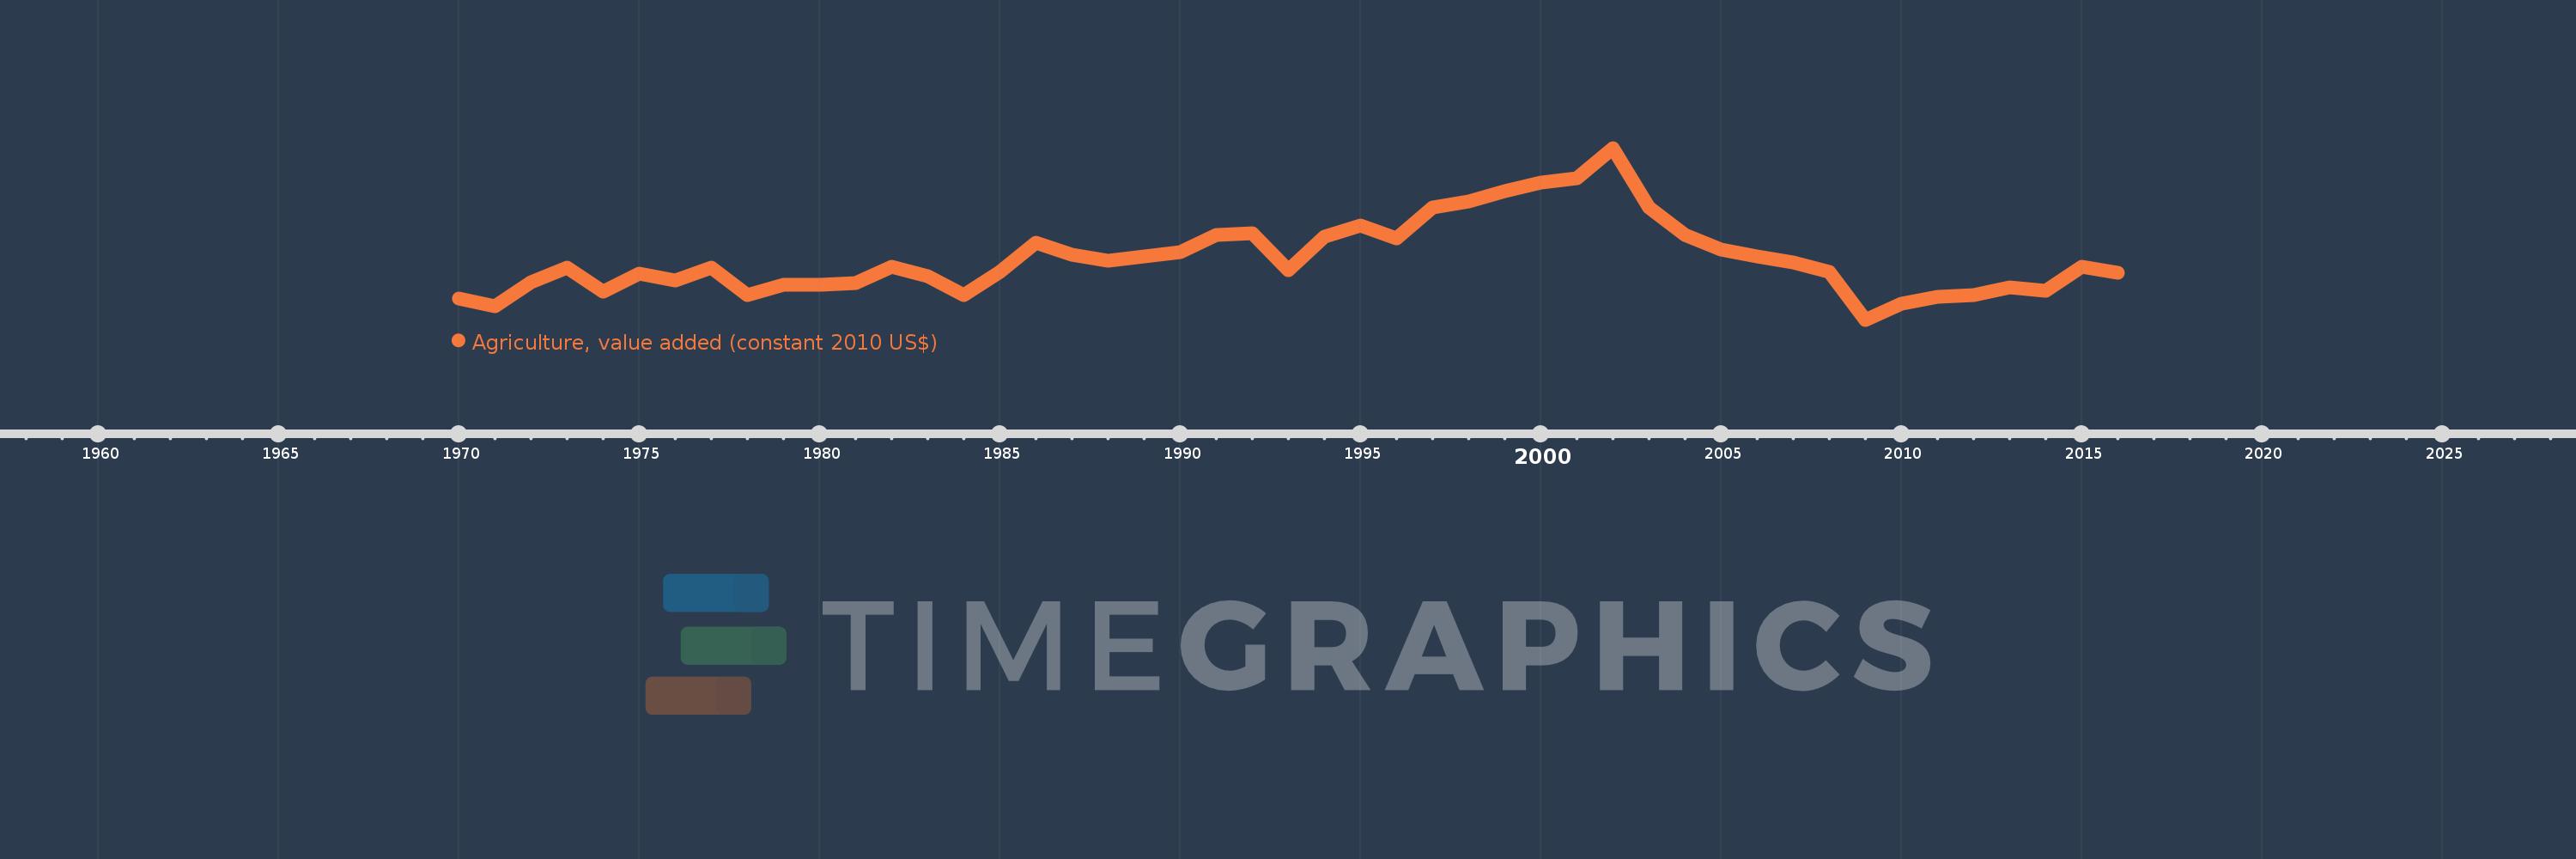
This timeline shows a graph from 1970 to 2016 of Zimbabwe. No data until 1969. Number of actual observations by date: 47.
Source name:
World Development Indicators
Source organization:
World Bank national accounts data, and OECD National Accounts data files.
Categories, topics:
Economy & Growth
Last updated:
apr 23, 2017
Indicators value changes by year
Minimum:
884.575 mln
jan 1, 2009
Maximum:
2.923 bln
jan 1, 2002
At the date of observation
Value
Absolute change
Change from previous value
jan 1, 1970
1.131 bln
+1.131 bln
0.0%
jan 1, 1971
1.046 bln
-84.993 mln
-7.51%
jan 1, 1972
1.328 bln
+281.355 mln
26.89%
jan 1, 1973
1.501 bln
+172.926 mln
13.02%
jan 1, 1974
1.213 bln
-287.223 mln
-19.14%
jan 1, 1975
1.433 bln
+219.817 mln
18.12%
jan 1, 1976
1.348 bln
-84.997 mln
-5.93%
jan 1, 1977
1.501 bln
+152.403 mln
11.3%
jan 1, 1978
1.181 bln
-319.463 mln
-21.29%
jan 1, 1979
1.301 bln
+120.164 mln
10.17%
jan 1, 1980
1.301 bln
0.0
0.0%
jan 1, 1981
1.322 bln
+20.518 mln
1.58%
jan 1, 1982
1.509 bln
+187.574 mln
14.19%
jan 1, 1983
1.401 bln
-108.441 mln
-7.18%
jan 1, 1984
1.181 bln
-219.813 mln
-15.69%
jan 1, 1985
1.454 bln
+272.568 mln
23.08%
jan 1, 1986
1.8 bln
+345.861 mln
23.79%
jan 1, 1987
1.652 bln
-147.953 mln
-8.22%
jan 1, 1988
1.581 bln
-70.647 mln
-4.28%
jan 1, 1989
1.631 bln
+50.462 mln
3.19%
jan 1, 1990
1.688 bln
+56.399 mln
3.46%
jan 1, 1991
1.893 bln
+204.818 mln
12.14%
jan 1, 1992
1.912 bln
+19.591 mln
1.04%
jan 1, 1993
1.469 bln
-443.476 mln
-23.19%
jan 1, 1994
1.867 bln
+398.356 mln
27.12%
jan 1, 1995
2.004 bln
+136.545 mln
7.31%
jan 1, 1996
1.852 bln
-151.981 mln
-7.59%
jan 1, 1997
2.219 bln
+366.891 mln
19.81%
jan 1, 1998
2.29 bln
+71.241 mln
3.21%
jan 1, 1999
2.406 bln
+116.36 mln
5.08%
jan 1, 2000
2.514 bln
+107.394 mln
4.46%
jan 1, 2001
2.564 bln
+50.271 mln
2.0%
jan 1, 2002
2.923 bln
+358.936 mln
14.0%
jan 1, 2003
2.221 bln
-701.464 mln
-24.0%
jan 1, 2004
1.888 bln
-333.196 mln
-15.0%
jan 1, 2005
1.718 bln
-169.93 mln
-9.0%
jan 1, 2006
1.632 bln
-85.909 mln
-5.0%
jan 1, 2007
1.567 bln
-65.291 mln
-4.0%
jan 1, 2008
1.457 bln
-109.688 mln
-7.0%
jan 1, 2009
884.575 mln
-572.715 mln
-39.3%
jan 1, 2010
1.079 bln
+194.686 mln
22.01%
jan 1, 2011
1.157 bln
+77.926 mln
7.22%
jan 1, 2012
1.173 bln
+16.263 mln
1.41%
jan 1, 2013
1.265 bln
+91.912 mln
7.83%
jan 1, 2014
1.233 bln
-32.637 mln
-2.58%
jan 1, 2015
1.516 bln
+283.708 mln
23.01%
jan 1, 2016
1.438 bln
-78.49 mln
-5.18%
Ranking of countries by current statistics by years


Comments: