29
/
en
AIzaSyAYiBZKx7MnpbEhh9jyipgxe19OcubqV5w
April 1, 2024
226589
Puerto Rico
PRI
true
2
1
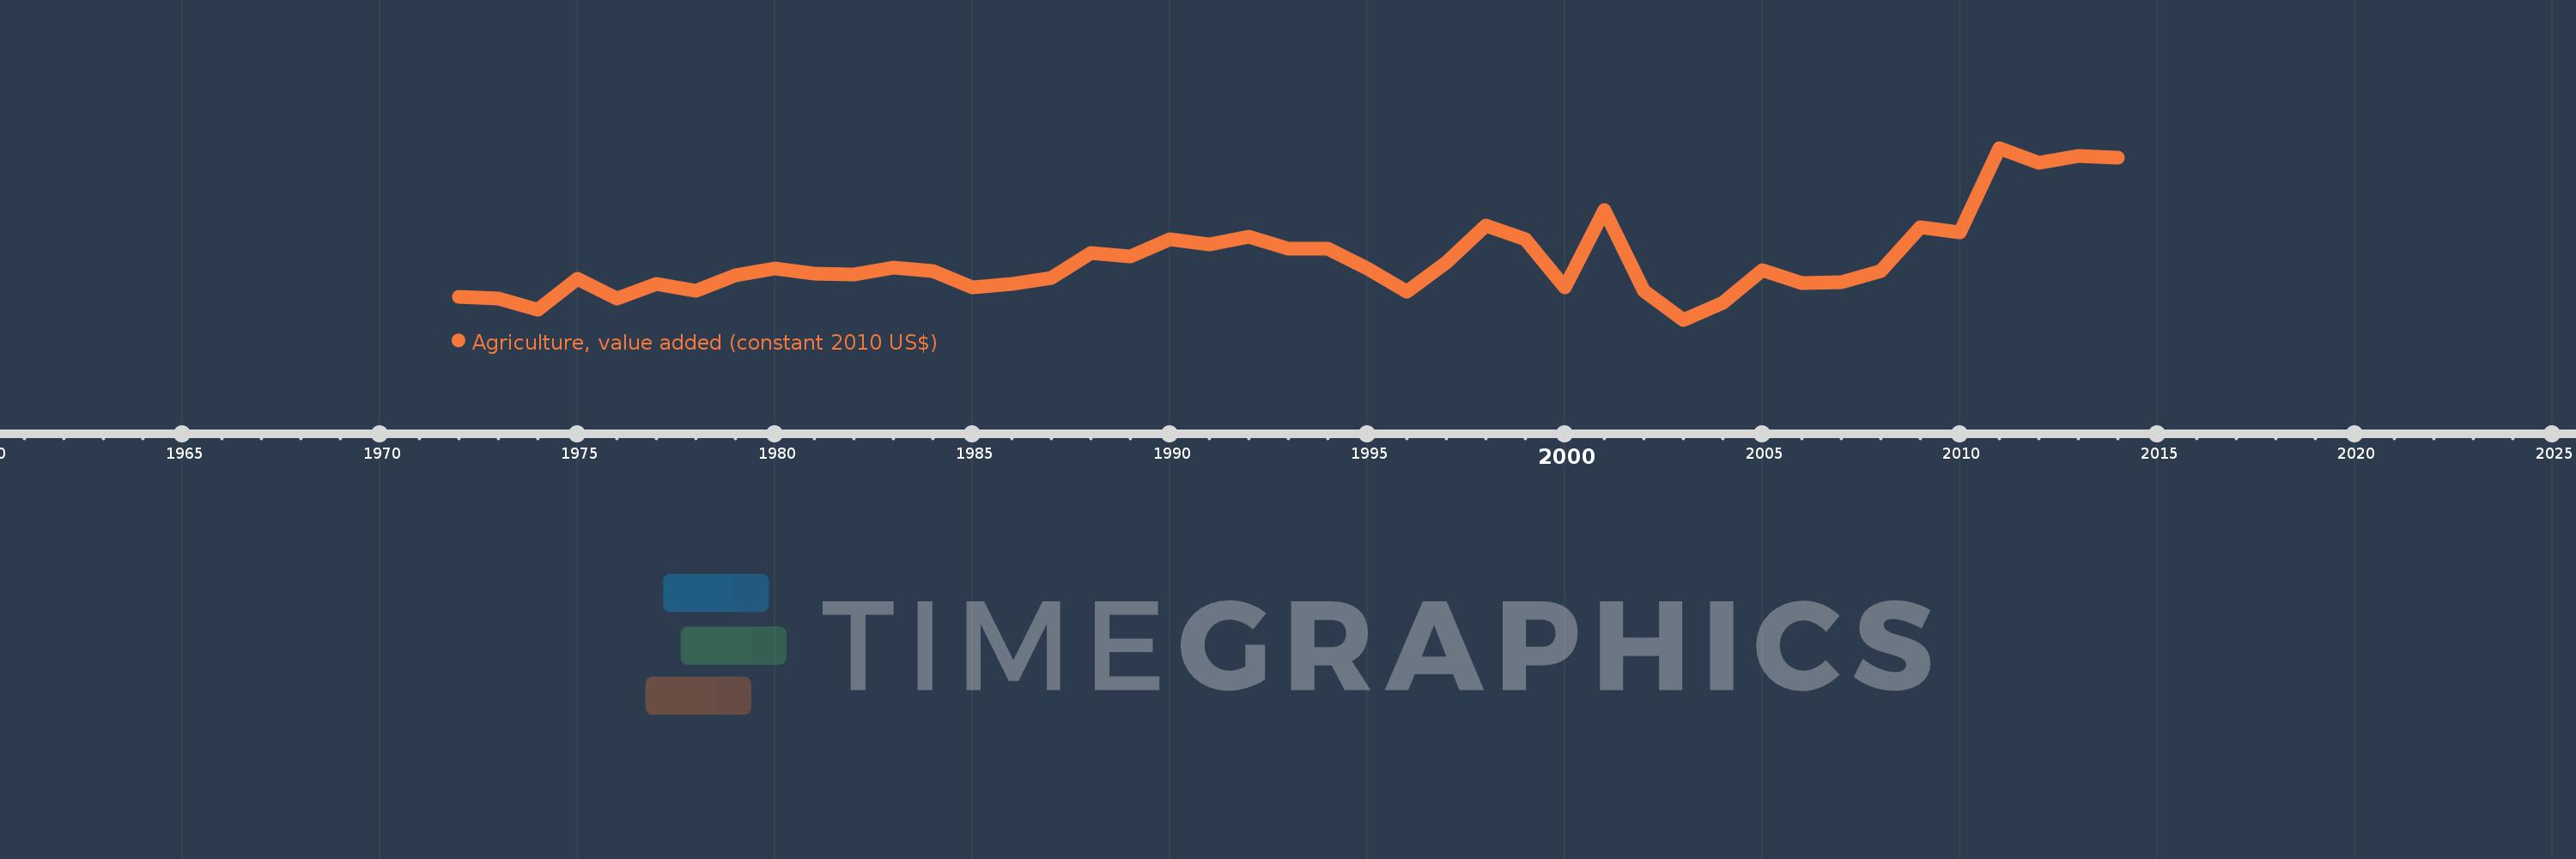
Agriculture, value added (constant 2010 US$)
2014,2013,2012,2011,2010,2009,2008,2007,2006,2005,2004,2003,2002,2001,2000,1999,1998,1997,1996,1995,1994,1993,1992,1991,1990,1989,1988,1987,1986,1985,1984,1983,1982,1981,1980,1979,1978,1977,1976,1975,1974,1973,1972
This statistics in other country:
AfghanistanAlbaniaAlgeriaAndorraAntigua and BarbudaArab WorldArgentinaArmeniaArubaAustraliaAustriaAzerbaijanBahamas, TheBahrainBangladeshBarbadosBelarusBelgiumBelizeBeninBermudaBhutanBoliviaBosnia and HerzegovinaBotswanaBrazilBrunei DarussalamBulgariaBurkina FasoBurundiCabo VerdeCambodiaCameroonCanadaCaribbean small statesCentral African RepublicCentral Europe and the BalticsChadChileChinaColombiaComorosCongo, Dem. Rep.Congo, Rep.Costa RicaCote d'IvoireCroatiaCubaCyprusCzech RepublicDenmarkDominicaDominican RepublicEarly-demographic dividendEast Asia & PacificEast Asia & Pacific (excluding high income)East Asia & Pacific (IDA & IBRD countries)EcuadorEgypt, Arab Rep.El SalvadorEquatorial GuineaEstoniaEthiopiaEuro areaEurope & Central AsiaEurope & Central Asia (excluding high income)Europe & Central Asia (IDA & IBRD countries)European UnionFijiFinlandFragile and conflict affected situationsFranceGabonGambia, TheGeorgiaGermanyGhanaGreeceGrenadaGuatemalaGuineaGuinea-BissauGuyanaHeavily indebted poor countries (HIPC)High incomeHondurasHong Kong SAR, ChinaHungaryIBRD onlyIcelandIDA & IBRD totalIDA blendIDA onlyIDA totalIndiaIndonesiaIran, Islamic Rep.IraqIrelandItalyJamaicaJapanJordanKazakhstanKenyaKiribatiKorea, Rep.KosovoKuwaitKyrgyz RepublicLao PDRLate-demographic dividendLatin America & Caribbean Latin America & Caribbean (excluding high income)Latin America & the Caribbean (IDA & IBRD countries)LatviaLeast developed countries: UN classificationLebanonLesothoLiberiaLithuaniaLow & middle incomeLow incomeLower middle incomeLuxembourgMacao SAR, ChinaMacedonia, FYRMadagascarMalawiMalaysiaMaldivesMaliMaltaMarshall IslandsMauritaniaMauritiusMexicoMicronesia, Fed. Sts.Middle East & North AfricaMiddle East & North Africa (excluding high income)Middle East & North Africa (IDA & IBRD countries)Middle incomeMoldovaMongoliaMontenegroMoroccoMozambiqueMyanmarNamibiaNepalNetherlandsNew ZealandNicaraguaNigerNigeriaNorth AmericaNorwayOECD membersOmanOther small statesPakistanPalauPanamaParaguayPeruPhilippinesPolandPortugalPost-demographic dividendPre-demographic dividendPuerto RicoQatarRomaniaRussian FederationRwandaSamoaSao Tome and PrincipeSaudi ArabiaSenegalSerbiaSeychellesSierra LeoneSingaporeSlovak RepublicSloveniaSmall statesSouth AfricaSouth AsiaSouth Asia (IDA & IBRD)SpainSri LankaSt. Kitts and NevisSt. LuciaSt. Vincent and the GrenadinesSub-Saharan Africa Sub-Saharan Africa (excluding high income)Sub-Saharan Africa (IDA & IBRD countries)SudanSurinameSwazilandSwedenSwitzerlandTajikistanTanzaniaThailandTimor-LesteTogoTongaTrinidad and TobagoTunisiaTurkeyTurkmenistanTuvaluUgandaUkraineUnited Arab EmiratesUnited KingdomUnited StatesUpper middle incomeUruguayUzbekistanVanuatuVenezuela, RBVietnamWest Bank and GazaWorldYemen, Rep.ZambiaZimbabwe Timeline:
This timeline shows a graph from 1972 to 2014 of Puerto Rico. No data until 1971. Number of actual observations by date: 43.
Source name:
World Development Indicators
Source organization:
World Bank national accounts data, and OECD National Accounts data files.
Categories, topics:
Economy & Growth
Last updated:
apr 23, 2017
Indicators value changes by year
Minimum:
334.491 mln
jan 1, 2003
Maximum:
822.0 mln
jan 1, 2011
At the date of observation
Value
Absolute change
Change from previous value
jan 1, 1972
399.14 mln
+399.14 mln
0.0%
jan 1, 1973
393.519 mln
-5.622 mln
-1.41%
jan 1, 1974
362.599 mln
-30.919 mln
-7.86%
jan 1, 1975
449.736 mln
+87.136 mln
24.03%
jan 1, 1976
393.519 mln
-56.217 mln
-12.5%
jan 1, 1977
435.681 mln
+42.163 mln
10.71%
jan 1, 1978
416.006 mln
-19.676 mln
-4.52%
jan 1, 1979
460.979 mln
+44.974 mln
10.81%
jan 1, 1980
480.655 mln
+19.676 mln
4.27%
jan 1, 1981
466.601 mln
-14.054 mln
-2.92%
jan 1, 1982
463.79 mln
-2.811 mln
-0.6%
jan 1, 1983
483.466 mln
+19.676 mln
4.24%
jan 1, 1984
472.222 mln
-11.243 mln
-2.33%
jan 1, 1985
427.249 mln
-44.974 mln
-9.52%
jan 1, 1986
435.681 mln
+8.433 mln
1.97%
jan 1, 1987
452.547 mln
+16.865 mln
3.87%
jan 1, 1988
522.818 mln
+70.271 mln
15.53%
jan 1, 1989
514.385 mln
-8.433 mln
-1.61%
jan 1, 1990
562.17 mln
+47.784 mln
9.29%
jan 1, 1991
548.115 mln
-14.054 mln
-2.5%
jan 1, 1992
570.602 mln
+22.487 mln
4.1%
jan 1, 1993
536.872 mln
-33.73 mln
-5.91%
jan 1, 1994
536.872 mln
0.0
0.0%
jan 1, 1995
480.655 mln
-56.217 mln
-10.47%
jan 1, 1996
413.195 mln
-67.46 mln
-14.04%
jan 1, 1997
497.52 mln
+84.325 mln
20.41%
jan 1, 1998
601.521 mln
+104.001 mln
20.9%
jan 1, 1999
562.17 mln
-39.352 mln
-6.54%
jan 1, 2000
427.249 mln
-134.921 mln
-24.0%
jan 1, 2001
646.495 mln
+219.246 mln
51.32%
jan 1, 2002
416.006 mln
-230.49 mln
-35.65%
jan 1, 2003
334.491 mln
-81.515 mln
-19.59%
jan 1, 2004
382.275 mln
+47.784 mln
14.29%
jan 1, 2005
475.033 mln
+92.758 mln
24.26%
jan 1, 2006
438.492 mln
-36.541 mln
-7.69%
jan 1, 2007
441.303 mln
+2.811 mln
0.64%
jan 1, 2008
472.222 mln
+30.919 mln
7.01%
jan 1, 2009
597.584 mln
+125.361 mln
26.55%
jan 1, 2010
581.244 mln
-16.34 mln
-2.73%
jan 1, 2011
822.0 mln
+240.756 mln
41.42%
jan 1, 2012
779.163 mln
-42.837 mln
-5.21%
jan 1, 2013
798.357 mln
+19.194 mln
2.46%
jan 1, 2014
795.539 mln
-2.819 mln
-0.35%
Ranking of countries by current statistics by years


Comments: