29
/
en
AIzaSyAYiBZKx7MnpbEhh9jyipgxe19OcubqV5w
April 1, 2024
162189
Jamaica
JAM
true
2
1
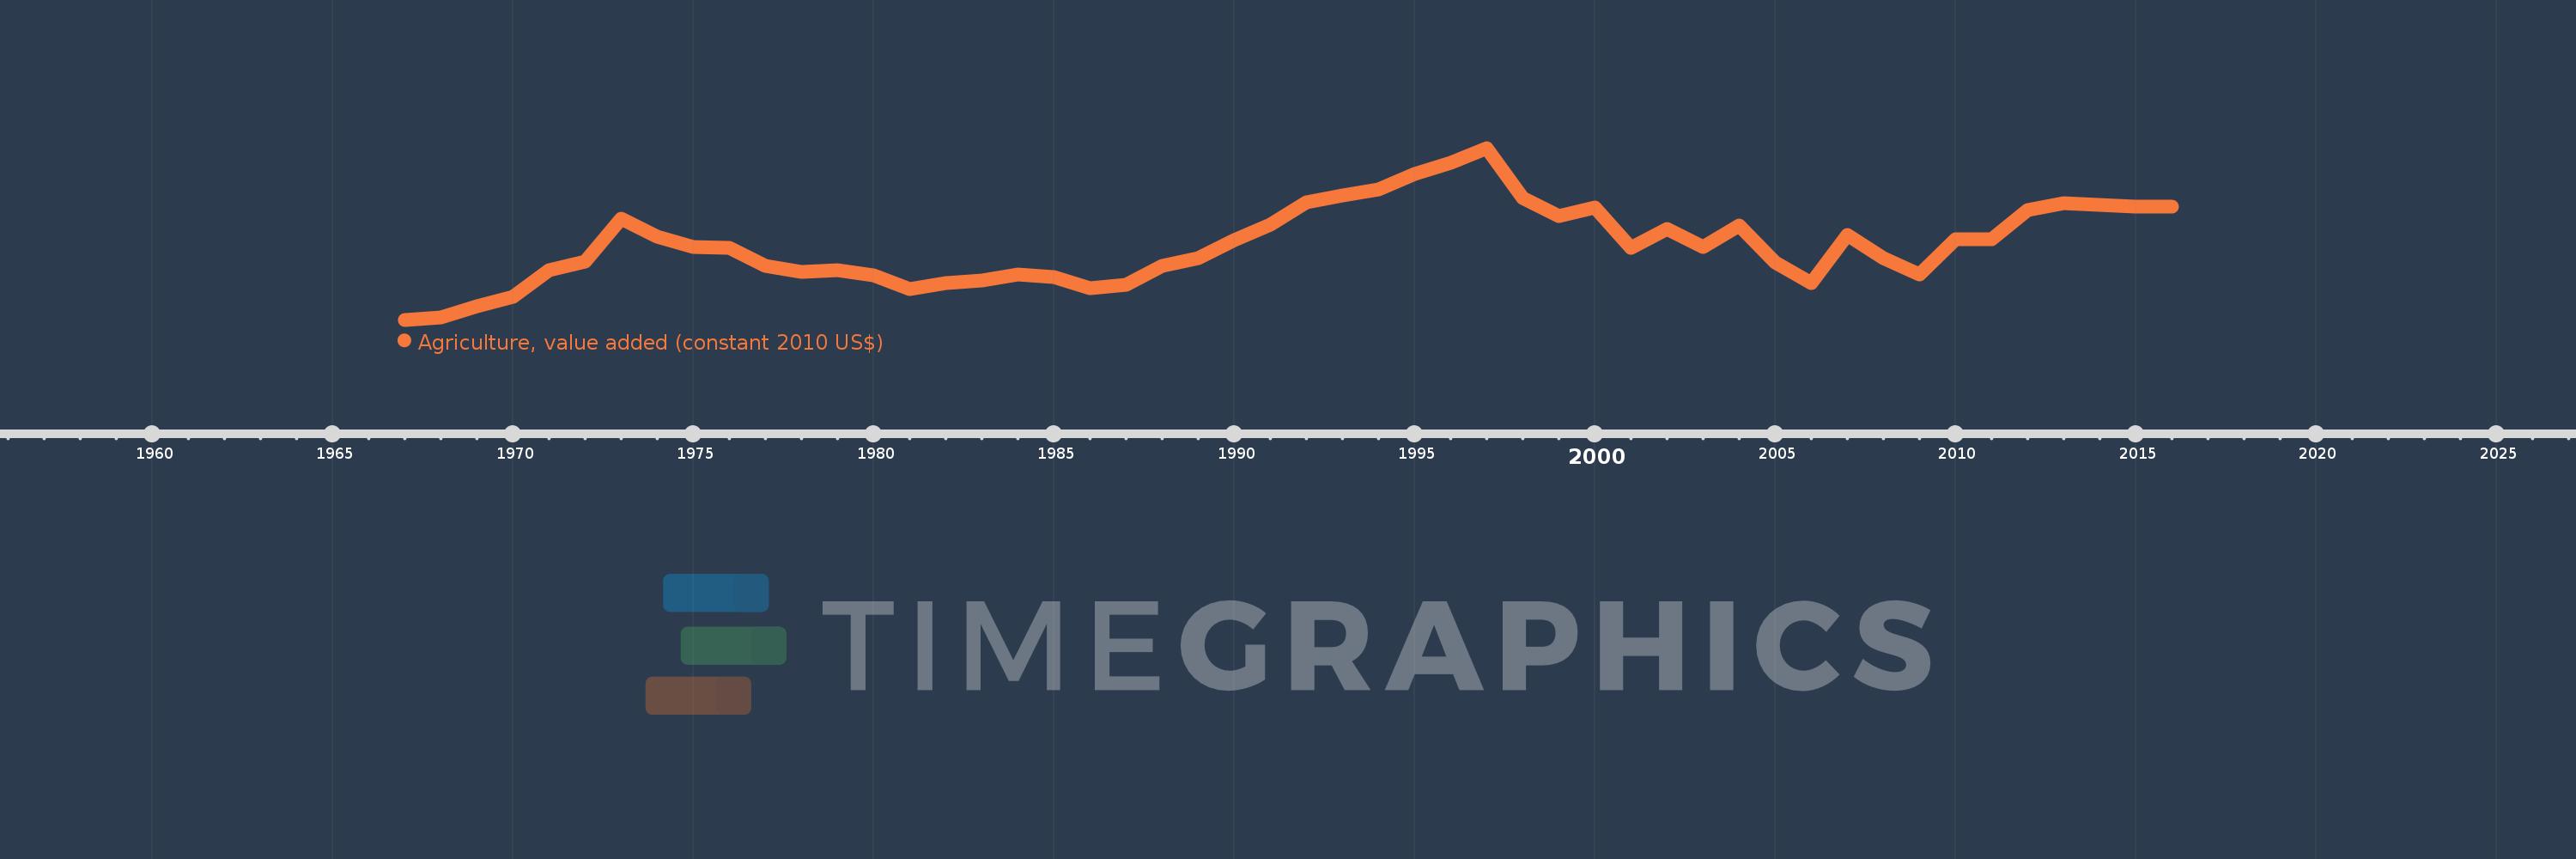
Agriculture, value added (constant 2010 US$)
2016,2015,2014,2013,2012,2011,2010,2009,2008,2007,2006,2005,2004,2003,2002,2001,2000,1999,1998,1997,1996,1995,1994,1993,1992,1991,1990,1989,1988,1987,1986,1985,1984,1983,1982,1981,1980,1979,1978,1977,1976,1975,1974,1973,1972,1971,1970,1969,1968,1967
This statistics in other country:
AfghanistanAlbaniaAlgeriaAndorraAntigua and BarbudaArab WorldArgentinaArmeniaArubaAustraliaAustriaAzerbaijanBahamas, TheBahrainBangladeshBarbadosBelarusBelgiumBelizeBeninBermudaBhutanBoliviaBosnia and HerzegovinaBotswanaBrazilBrunei DarussalamBulgariaBurkina FasoBurundiCabo VerdeCambodiaCameroonCanadaCaribbean small statesCentral African RepublicCentral Europe and the BalticsChadChileChinaColombiaComorosCongo, Dem. Rep.Congo, Rep.Costa RicaCote d'IvoireCroatiaCubaCyprusCzech RepublicDenmarkDominicaDominican RepublicEarly-demographic dividendEast Asia & PacificEast Asia & Pacific (excluding high income)East Asia & Pacific (IDA & IBRD countries)EcuadorEgypt, Arab Rep.El SalvadorEquatorial GuineaEstoniaEthiopiaEuro areaEurope & Central AsiaEurope & Central Asia (excluding high income)Europe & Central Asia (IDA & IBRD countries)European UnionFijiFinlandFragile and conflict affected situationsFranceGabonGambia, TheGeorgiaGermanyGhanaGreeceGrenadaGuatemalaGuineaGuinea-BissauGuyanaHeavily indebted poor countries (HIPC)High incomeHondurasHong Kong SAR, ChinaHungaryIBRD onlyIcelandIDA & IBRD totalIDA blendIDA onlyIDA totalIndiaIndonesiaIran, Islamic Rep.IraqIrelandItalyJamaicaJapanJordanKazakhstanKenyaKiribatiKorea, Rep.KosovoKuwaitKyrgyz RepublicLao PDRLate-demographic dividendLatin America & Caribbean Latin America & Caribbean (excluding high income)Latin America & the Caribbean (IDA & IBRD countries)LatviaLeast developed countries: UN classificationLebanonLesothoLiberiaLithuaniaLow & middle incomeLow incomeLower middle incomeLuxembourgMacao SAR, ChinaMacedonia, FYRMadagascarMalawiMalaysiaMaldivesMaliMaltaMarshall IslandsMauritaniaMauritiusMexicoMicronesia, Fed. Sts.Middle East & North AfricaMiddle East & North Africa (excluding high income)Middle East & North Africa (IDA & IBRD countries)Middle incomeMoldovaMongoliaMontenegroMoroccoMozambiqueMyanmarNamibiaNepalNetherlandsNew ZealandNicaraguaNigerNigeriaNorth AmericaNorwayOECD membersOmanOther small statesPakistanPalauPanamaParaguayPeruPhilippinesPolandPortugalPost-demographic dividendPre-demographic dividendPuerto RicoQatarRomaniaRussian FederationRwandaSamoaSao Tome and PrincipeSaudi ArabiaSenegalSerbiaSeychellesSierra LeoneSingaporeSlovak RepublicSloveniaSmall statesSouth AfricaSouth AsiaSouth Asia (IDA & IBRD)SpainSri LankaSt. Kitts and NevisSt. LuciaSt. Vincent and the GrenadinesSub-Saharan Africa Sub-Saharan Africa (excluding high income)Sub-Saharan Africa (IDA & IBRD countries)SudanSurinameSwazilandSwedenSwitzerlandTajikistanTanzaniaThailandTimor-LesteTogoTongaTrinidad and TobagoTunisiaTurkeyTurkmenistanTuvaluUgandaUkraineUnited Arab EmiratesUnited KingdomUnited StatesUpper middle incomeUruguayUzbekistanVanuatuVenezuela, RBVietnamWest Bank and GazaWorldYemen, Rep.ZambiaZimbabwe Timeline:
This timeline shows a graph from 1967 to 2016 of Jamaica. No data until 1966. Number of actual observations by date: 50.
Source name:
World Development Indicators
Source organization:
World Bank national accounts data, and OECD National Accounts data files.
Categories, topics:
Economy & Growth
Last updated:
apr 23, 2017
Indicators value changes by year
Minimum:
499.578 mln
jan 1, 1967
Maximum:
918.167 mln
jan 1, 1997
At the date of observation
Value
Absolute change
Change from previous value
jan 1, 1967
499.578 mln
+499.578 mln
0.0%
jan 1, 1968
506.095 mln
+6.517 mln
1.3%
jan 1, 1969
531.837 mln
+25.741 mln
5.09%
jan 1, 1970
556.007 mln
+24.17 mln
4.54%
jan 1, 1971
620.997 mln
+64.99 mln
11.69%
jan 1, 1972
640.469 mln
+19.473 mln
3.14%
jan 1, 1973
745.402 mln
+104.933 mln
16.38%
jan 1, 1974
702.325 mln
-43.078 mln
-5.78%
jan 1, 1975
676.929 mln
-25.396 mln
-3.62%
jan 1, 1976
674.86 mln
-2.069 mln
-0.31%
jan 1, 1977
631.281 mln
-43.579 mln
-6.46%
jan 1, 1978
616.265 mln
-15.015 mln
-2.38%
jan 1, 1979
619.695 mln
+3.429 mln
0.56%
jan 1, 1980
608.387 mln
-11.308 mln
-1.82%
jan 1, 1981
573.377 mln
-35.01 mln
-5.75%
jan 1, 1982
587.988 mln
+14.611 mln
2.55%
jan 1, 1983
595.39 mln
+7.402 mln
1.26%
jan 1, 1984
608.931 mln
+13.541 mln
2.27%
jan 1, 1985
603.694 mln
-5.237 mln
-0.86%
jan 1, 1986
576.212 mln
-27.481 mln
-4.55%
jan 1, 1987
585.532 mln
+9.319 mln
1.62%
jan 1, 1988
631.18 mln
+45.648 mln
7.8%
jan 1, 1989
649.173 mln
+17.994 mln
2.85%
jan 1, 1990
693.443 mln
+44.27 mln
6.82%
jan 1, 1991
731.344 mln
+37.9 mln
5.47%
jan 1, 1992
786.5 mln
+55.157 mln
7.54%
jan 1, 1993
801.587 mln
+15.087 mln
1.92%
jan 1, 1994
817.626 mln
+16.039 mln
2.0%
jan 1, 1995
854.134 mln
+36.508 mln
4.47%
jan 1, 1996
882.811 mln
+28.677 mln
3.36%
jan 1, 1997
918.167 mln
+35.356 mln
4.0%
jan 1, 1998
795.646 mln
-122.52 mln
-13.34%
jan 1, 1999
753.059 mln
-42.588 mln
-5.35%
jan 1, 2000
773.709 mln
+20.65 mln
2.74%
jan 1, 2001
675.649 mln
-98.06 mln
-12.67%
jan 1, 2002
720.796 mln
+45.147 mln
6.68%
jan 1, 2003
677.077 mln
-43.719 mln
-6.07%
jan 1, 2004
728.325 mln
+51.247 mln
7.57%
jan 1, 2005
639.128 mln
-89.197 mln
-12.25%
jan 1, 2006
589.392 mln
-49.736 mln
-7.78%
jan 1, 2007
707.129 mln
+117.738 mln
19.98%
jan 1, 2008
649.809 mln
-57.32 mln
-8.11%
jan 1, 2009
609.734 mln
-40.075 mln
-6.17%
jan 1, 2010
694.966 mln
+85.232 mln
13.98%
jan 1, 2011
695.125 mln
+158.897K
0.02%
jan 1, 2012
766.708 mln
+71.583 mln
10.3%
jan 1, 2013
784.488 mln
+17.781 mln
2.32%
jan 1, 2014
778.879 mln
-5.609 mln
-0.71%
jan 1, 2015
775.129 mln
-3.75 mln
-0.48%
jan 1, 2016
774.732 mln
-397.241K
-0.05%
Ranking of countries by current statistics by years


Comments: