29
/
en
AIzaSyAYiBZKx7MnpbEhh9jyipgxe19OcubqV5w
April 1, 2024
280600
Venezuela, RB
VEN
true
2
1
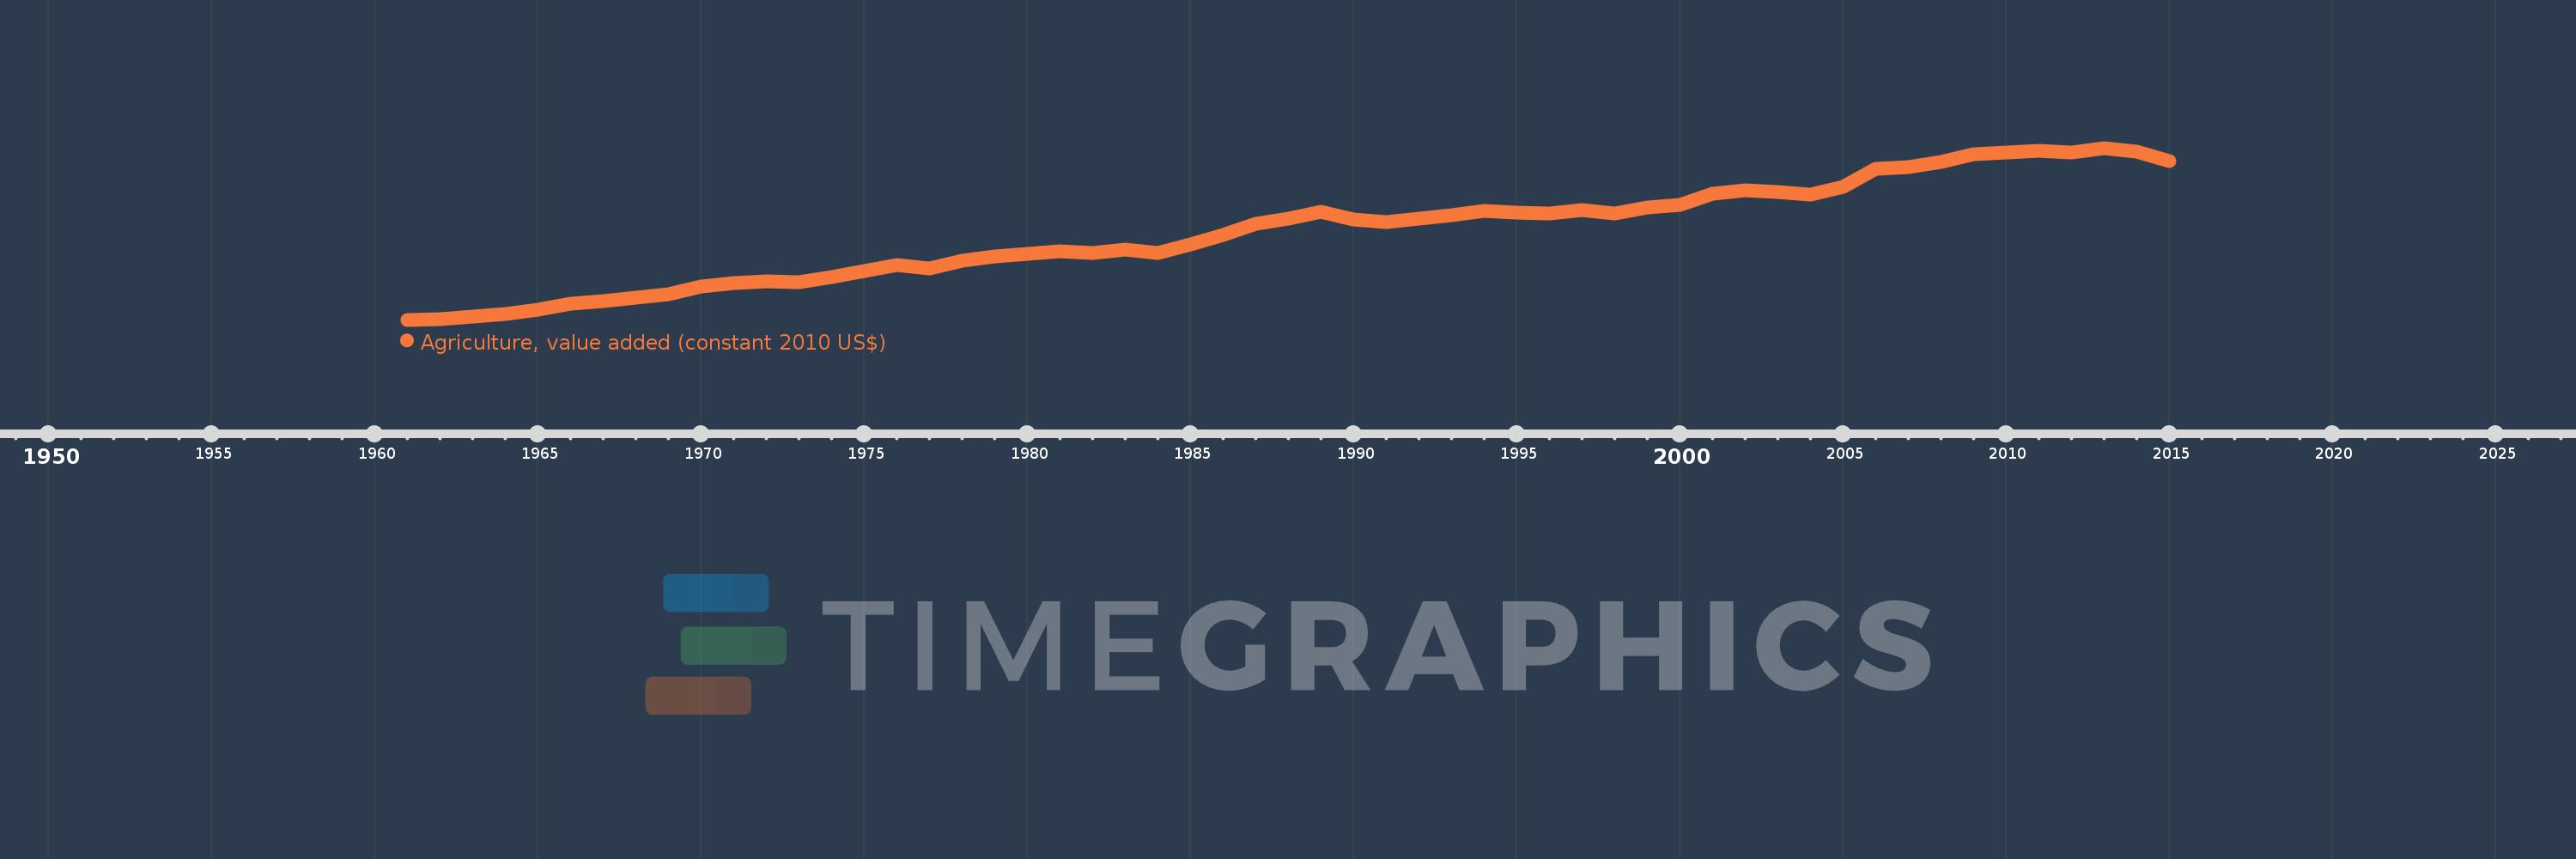
Agriculture, value added (constant 2010 US$)
2015,2014,2013,2012,2011,2010,2009,2008,2007,2006,2005,2004,2003,2002,2001,2000,1999,1998,1997,1996,1995,1994,1993,1992,1991,1990,1989,1988,1987,1986,1985,1984,1983,1982,1981,1980,1979,1978,1977,1976,1975,1974,1973,1972,1971,1970,1969,1968,1967,1966,1965,1964,1963,1962,1961
This statistics in other country:
AfghanistanAlbaniaAlgeriaAndorraAntigua and BarbudaArab WorldArgentinaArmeniaArubaAustraliaAustriaAzerbaijanBahamas, TheBahrainBangladeshBarbadosBelarusBelgiumBelizeBeninBermudaBhutanBoliviaBosnia and HerzegovinaBotswanaBrazilBrunei DarussalamBulgariaBurkina FasoBurundiCabo VerdeCambodiaCameroonCanadaCaribbean small statesCentral African RepublicCentral Europe and the BalticsChadChileChinaColombiaComorosCongo, Dem. Rep.Congo, Rep.Costa RicaCote d'IvoireCroatiaCubaCyprusCzech RepublicDenmarkDominicaDominican RepublicEarly-demographic dividendEast Asia & PacificEast Asia & Pacific (excluding high income)East Asia & Pacific (IDA & IBRD countries)EcuadorEgypt, Arab Rep.El SalvadorEquatorial GuineaEstoniaEthiopiaEuro areaEurope & Central AsiaEurope & Central Asia (excluding high income)Europe & Central Asia (IDA & IBRD countries)European UnionFijiFinlandFragile and conflict affected situationsFranceGabonGambia, TheGeorgiaGermanyGhanaGreeceGrenadaGuatemalaGuineaGuinea-BissauGuyanaHeavily indebted poor countries (HIPC)High incomeHondurasHong Kong SAR, ChinaHungaryIBRD onlyIcelandIDA & IBRD totalIDA blendIDA onlyIDA totalIndiaIndonesiaIran, Islamic Rep.IraqIrelandItalyJamaicaJapanJordanKazakhstanKenyaKiribatiKorea, Rep.KosovoKuwaitKyrgyz RepublicLao PDRLate-demographic dividendLatin America & Caribbean Latin America & Caribbean (excluding high income)Latin America & the Caribbean (IDA & IBRD countries)LatviaLeast developed countries: UN classificationLebanonLesothoLiberiaLithuaniaLow & middle incomeLow incomeLower middle incomeLuxembourgMacao SAR, ChinaMacedonia, FYRMadagascarMalawiMalaysiaMaldivesMaliMaltaMarshall IslandsMauritaniaMauritiusMexicoMicronesia, Fed. Sts.Middle East & North AfricaMiddle East & North Africa (excluding high income)Middle East & North Africa (IDA & IBRD countries)Middle incomeMoldovaMongoliaMontenegroMoroccoMozambiqueMyanmarNamibiaNepalNetherlandsNew ZealandNicaraguaNigerNigeriaNorth AmericaNorwayOECD membersOmanOther small statesPakistanPalauPanamaParaguayPeruPhilippinesPolandPortugalPost-demographic dividendPre-demographic dividendPuerto RicoQatarRomaniaRussian FederationRwandaSamoaSao Tome and PrincipeSaudi ArabiaSenegalSerbiaSeychellesSierra LeoneSingaporeSlovak RepublicSloveniaSmall statesSouth AfricaSouth AsiaSouth Asia (IDA & IBRD)SpainSri LankaSt. Kitts and NevisSt. LuciaSt. Vincent and the GrenadinesSub-Saharan Africa Sub-Saharan Africa (excluding high income)Sub-Saharan Africa (IDA & IBRD countries)SudanSurinameSwazilandSwedenSwitzerlandTajikistanTanzaniaThailandTimor-LesteTogoTongaTrinidad and TobagoTunisiaTurkeyTurkmenistanTuvaluUgandaUkraineUnited Arab EmiratesUnited KingdomUnited StatesUpper middle incomeUruguayUzbekistanVanuatuVenezuela, RBVietnamWest Bank and GazaWorldYemen, Rep.ZambiaZimbabwe Timeline:
This timeline shows a graph from 1961 to 2015 of Venezuela, RB. No data until 1960. Number of actual observations by date: 55.
Source name:
World Development Indicators
Source organization:
World Bank national accounts data, and OECD National Accounts data files.
Categories, topics:
Economy & Growth
Last updated:
apr 23, 2017
Indicators value changes by year
Minimum:
4.643 bln
jan 1, 1961
Maximum:
21.41 bln
jan 1, 2013
At the date of observation
Value
Absolute change
Change from previous value
jan 1, 1961
4.643 bln
+4.643 bln
0.0%
jan 1, 1962
4.672 bln
+29.118 mln
0.63%
jan 1, 1963
4.914 bln
+242.031 mln
5.18%
jan 1, 1964
5.188 bln
+273.395 mln
5.56%
jan 1, 1965
5.605 bln
+416.788 mln
8.03%
jan 1, 1966
6.2 bln
+595.605 mln
10.63%
jan 1, 1967
6.45 bln
+249.746 mln
4.03%
jan 1, 1968
6.829 bln
+378.96 mln
5.88%
jan 1, 1969
7.127 bln
+298.1 mln
4.37%
jan 1, 1970
7.864 bln
+736.673 mln
10.34%
jan 1, 1971
8.218 bln
+353.942 mln
4.5%
jan 1, 1972
8.431 bln
+213.826 mln
2.6%
jan 1, 1973
8.311 bln
-120.838 mln
-1.43%
jan 1, 1974
8.84 bln
+529.228 mln
6.37%
jan 1, 1975
9.433 bln
+593.632 mln
6.72%
jan 1, 1976
10.012 bln
+578.641 mln
6.13%
jan 1, 1977
9.671 bln
-341.564 mln
-3.41%
jan 1, 1978
10.443 bln
+772.473 mln
7.99%
jan 1, 1979
10.83 bln
+387.321 mln
3.71%
jan 1, 1980
11.102 bln
+271.582 mln
2.51%
jan 1, 1981
11.32 bln
+217.989 mln
1.96%
jan 1, 1982
11.123 bln
-196.99 mln
-1.74%
jan 1, 1983
11.458 bln
+335.175 mln
3.01%
jan 1, 1984
11.161 bln
-297.094 mln
-2.59%
jan 1, 1985
11.966 bln
+805.149 mln
7.21%
jan 1, 1986
12.939 bln
+972.787 mln
8.13%
jan 1, 1987
13.984 bln
+1.045 bln
8.07%
jan 1, 1988
14.539 bln
+555.958 mln
3.98%
jan 1, 1989
15.214 bln
+674.495 mln
4.64%
jan 1, 1990
14.434 bln
-779.677 mln
-5.12%
jan 1, 1991
14.182 bln
-252.658 mln
-1.75%
jan 1, 1992
14.531 bln
+349.491 mln
2.46%
jan 1, 1993
14.825 bln
+293.839 mln
2.02%
jan 1, 1994
15.274 bln
+448.55 mln
3.03%
jan 1, 1995
15.105 bln
-168.623 mln
-1.1%
jan 1, 1996
15.023 bln
-81.808 mln
-0.54%
jan 1, 1997
15.319 bln
+295.509 mln
1.97%
jan 1, 1998
15.049 bln
-269.401 mln
-1.76%
jan 1, 1999
15.575 bln
+526.138 mln
3.5%
jan 1, 2000
15.867 bln
+291.303 mln
1.87%
jan 1, 2001
16.906 bln
+1.039 bln
6.55%
jan 1, 2002
17.25 bln
+344.371 mln
2.04%
jan 1, 2003
17.112 bln
-138.013 mln
-0.8%
jan 1, 2004
16.888 bln
-223.98 mln
-1.31%
jan 1, 2005
17.628 bln
+739.582 mln
4.38%
jan 1, 2006
19.361 bln
+1.734 bln
9.84%
jan 1, 2007
19.562 bln
+200.268 mln
1.03%
jan 1, 2008
20.068 bln
+506.296 mln
2.59%
jan 1, 2009
20.767 bln
+699.436 mln
3.49%
jan 1, 2010
20.975 bln
+207.674 mln
1.0%
jan 1, 2011
21.168 bln
+192.917 mln
0.92%
jan 1, 2012
20.994 bln
-173.41 mln
-0.82%
jan 1, 2013
21.41 bln
+415.7 mln
1.98%
jan 1, 2014
21.048 bln
-362.121 mln
-1.69%
jan 1, 2015
20.087 bln
-960.945 mln
-4.57%
Ranking of countries by current statistics by years


Comments: