29
/
en
AIzaSyAYiBZKx7MnpbEhh9jyipgxe19OcubqV5w
April 1, 2024
229419
Russian Federation
RUS
true
2
1
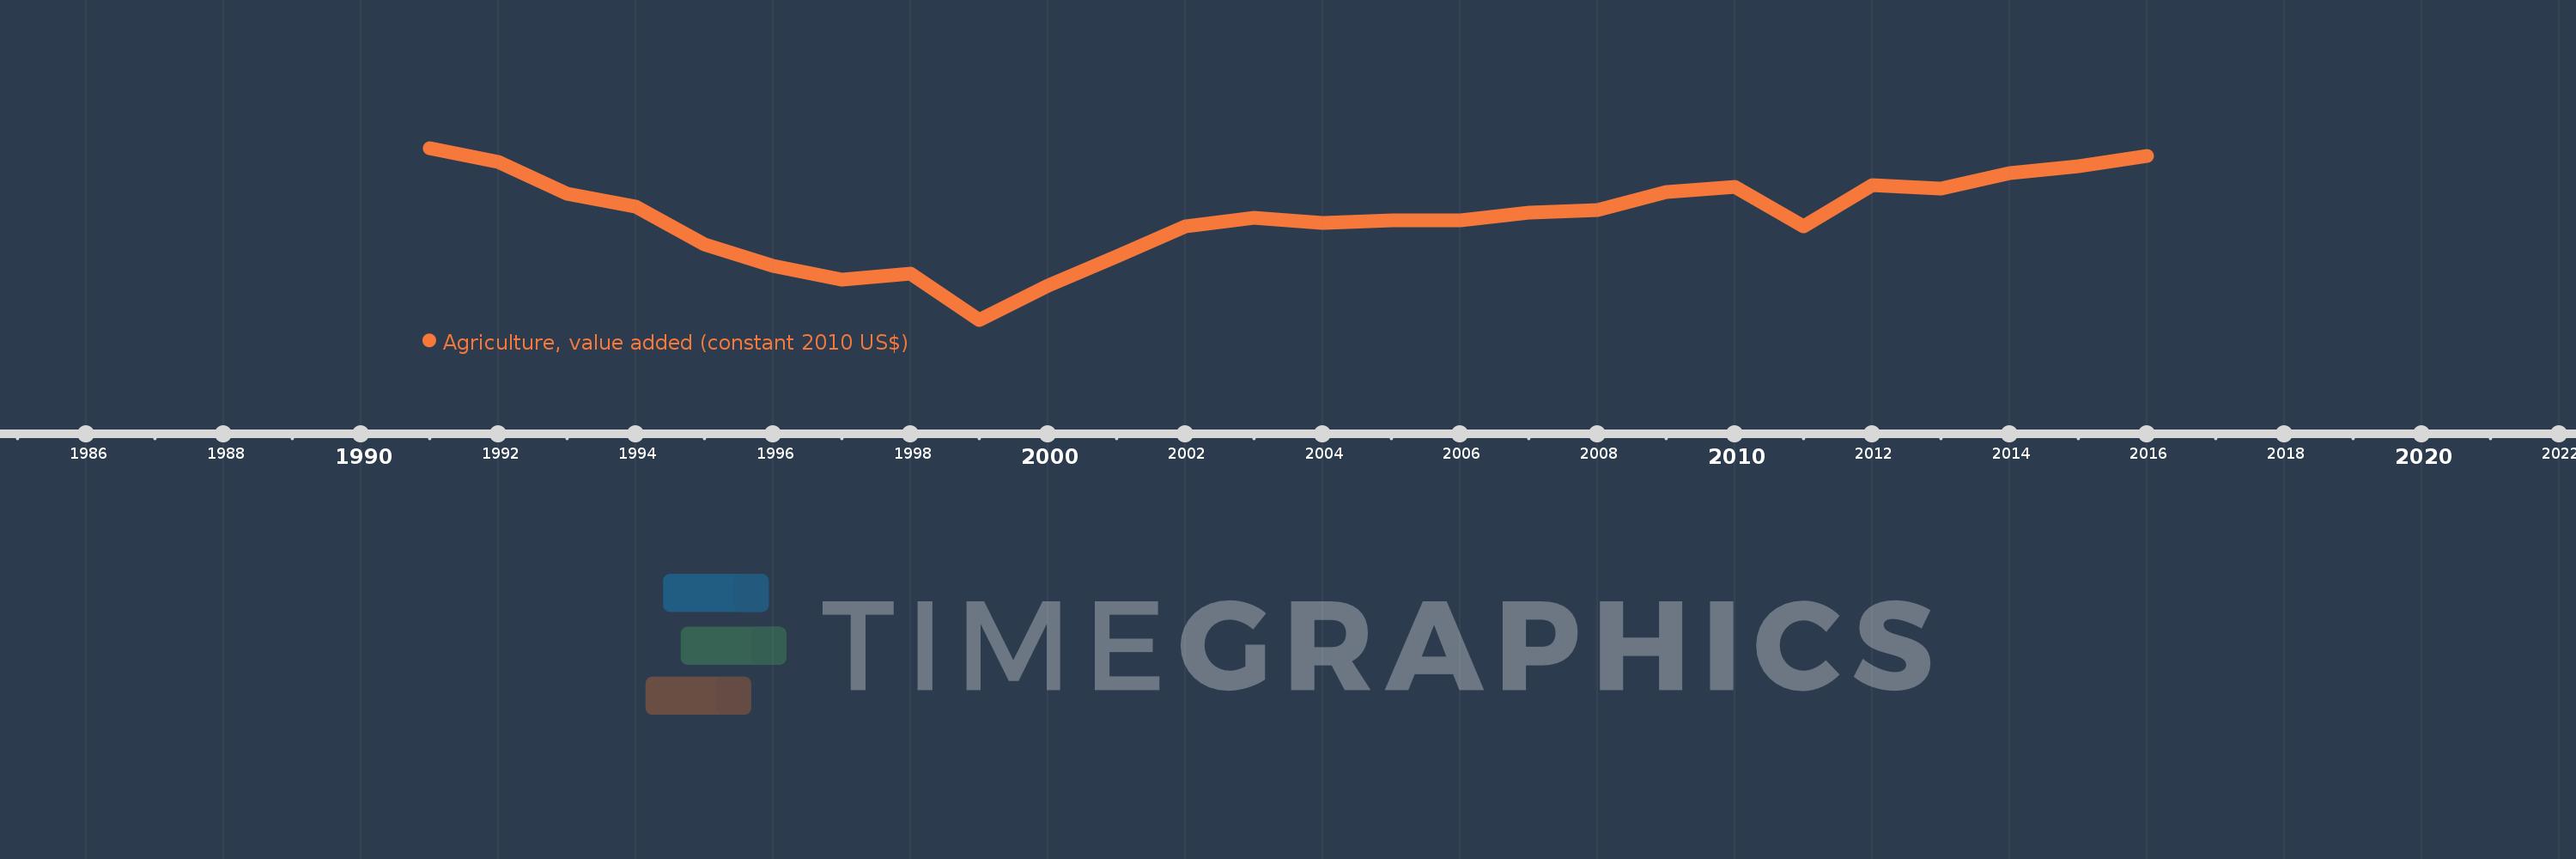
Agriculture, value added (constant 2010 US$)
2016,2015,2014,2013,2012,2011,2010,2009,2008,2007,2006,2005,2004,2003,2002,2001,2000,1999,1998,1997,1996,1995,1994,1993,1992,1991
This statistics in other country:
AfghanistanAlbaniaAlgeriaAndorraAntigua and BarbudaArab WorldArgentinaArmeniaArubaAustraliaAustriaAzerbaijanBahamas, TheBahrainBangladeshBarbadosBelarusBelgiumBelizeBeninBermudaBhutanBoliviaBosnia and HerzegovinaBotswanaBrazilBrunei DarussalamBulgariaBurkina FasoBurundiCabo VerdeCambodiaCameroonCanadaCaribbean small statesCentral African RepublicCentral Europe and the BalticsChadChileChinaColombiaComorosCongo, Dem. Rep.Congo, Rep.Costa RicaCote d'IvoireCroatiaCubaCyprusCzech RepublicDenmarkDominicaDominican RepublicEarly-demographic dividendEast Asia & PacificEast Asia & Pacific (excluding high income)East Asia & Pacific (IDA & IBRD countries)EcuadorEgypt, Arab Rep.El SalvadorEquatorial GuineaEstoniaEthiopiaEuro areaEurope & Central AsiaEurope & Central Asia (excluding high income)Europe & Central Asia (IDA & IBRD countries)European UnionFijiFinlandFragile and conflict affected situationsFranceGabonGambia, TheGeorgiaGermanyGhanaGreeceGrenadaGuatemalaGuineaGuinea-BissauGuyanaHeavily indebted poor countries (HIPC)High incomeHondurasHong Kong SAR, ChinaHungaryIBRD onlyIcelandIDA & IBRD totalIDA blendIDA onlyIDA totalIndiaIndonesiaIran, Islamic Rep.IraqIrelandItalyJamaicaJapanJordanKazakhstanKenyaKiribatiKorea, Rep.KosovoKuwaitKyrgyz RepublicLao PDRLate-demographic dividendLatin America & Caribbean Latin America & Caribbean (excluding high income)Latin America & the Caribbean (IDA & IBRD countries)LatviaLeast developed countries: UN classificationLebanonLesothoLiberiaLithuaniaLow & middle incomeLow incomeLower middle incomeLuxembourgMacao SAR, ChinaMacedonia, FYRMadagascarMalawiMalaysiaMaldivesMaliMaltaMarshall IslandsMauritaniaMauritiusMexicoMicronesia, Fed. Sts.Middle East & North AfricaMiddle East & North Africa (excluding high income)Middle East & North Africa (IDA & IBRD countries)Middle incomeMoldovaMongoliaMontenegroMoroccoMozambiqueMyanmarNamibiaNepalNetherlandsNew ZealandNicaraguaNigerNigeriaNorth AmericaNorwayOECD membersOmanOther small statesPakistanPalauPanamaParaguayPeruPhilippinesPolandPortugalPost-demographic dividendPre-demographic dividendPuerto RicoQatarRomaniaRussian FederationRwandaSamoaSao Tome and PrincipeSaudi ArabiaSenegalSerbiaSeychellesSierra LeoneSingaporeSlovak RepublicSloveniaSmall statesSouth AfricaSouth AsiaSouth Asia (IDA & IBRD)SpainSri LankaSt. Kitts and NevisSt. LuciaSt. Vincent and the GrenadinesSub-Saharan Africa Sub-Saharan Africa (excluding high income)Sub-Saharan Africa (IDA & IBRD countries)SudanSurinameSwazilandSwedenSwitzerlandTajikistanTanzaniaThailandTimor-LesteTogoTongaTrinidad and TobagoTunisiaTurkeyTurkmenistanTuvaluUgandaUkraineUnited Arab EmiratesUnited KingdomUnited StatesUpper middle incomeUruguayUzbekistanVanuatuVenezuela, RBVietnamWest Bank and GazaWorldYemen, Rep.ZambiaZimbabwe Timeline:
This timeline shows a graph from 1991 to 2016 of Russian Federation. No data until 1990. Number of actual observations by date: 26.
Source name:
World Development Indicators
Source organization:
World Bank national accounts data, and OECD National Accounts data files.
Categories, topics:
Economy & Growth
Last updated:
apr 23, 2017
Indicators value changes by year
Minimum:
34.754 bln
jan 1, 1999
Maximum:
64.739 bln
jan 1, 1991
At the date of observation
Value
Absolute change
Change from previous value
jan 1, 1991
64.739 bln
+64.739 bln
0.0%
jan 1, 1992
62.344 bln
-2.395 bln
-3.7%
jan 1, 1993
56.733 bln
-5.611 bln
-9.0%
jan 1, 1994
54.464 bln
-2.269 bln
-4.0%
jan 1, 1995
47.928 bln
-6.536 bln
-12.0%
jan 1, 1996
44.094 bln
-3.834 bln
-8.0%
jan 1, 1997
41.757 bln
-2.337 bln
-5.3%
jan 1, 1998
42.801 bln
+1.044 bln
2.5%
jan 1, 1999
34.754 bln
-8.047 bln
-18.8%
jan 1, 2000
40.697 bln
+5.943 bln
17.1%
jan 1, 2001
45.866 bln
+5.169 bln
12.7%
jan 1, 2002
51.094 bln
+5.228 bln
11.4%
jan 1, 2003
52.579 bln
+1.484 bln
2.91%
jan 1, 2004
51.637 bln
-941.638 mln
-1.79%
jan 1, 2005
52.172 bln
+535.051 mln
1.04%
jan 1, 2006
52.094 bln
-78.033 mln
-0.15%
jan 1, 2007
53.398 bln
+1.304 bln
2.5%
jan 1, 2008
53.888 bln
+490.486 mln
0.92%
jan 1, 2009
56.975 bln
+3.087 bln
5.73%
jan 1, 2010
57.933 bln
+957.47 mln
1.68%
jan 1, 2011
50.992 bln
-6.941 bln
-11.98%
jan 1, 2012
58.225 bln
+7.233 bln
14.18%
jan 1, 2013
57.587 bln
-637.099 mln
-1.09%
jan 1, 2014
60.292 bln
+2.704 bln
4.7%
jan 1, 2015
61.492 bln
+1.2 bln
1.99%
jan 1, 2016
63.277 bln
+1.785 bln
2.9%
Ranking of countries by current statistics by years


Comments: