29
/
en
AIzaSyAYiBZKx7MnpbEhh9jyipgxe19OcubqV5w
April 1, 2024
145329
Guinea
GIN
true
2
1
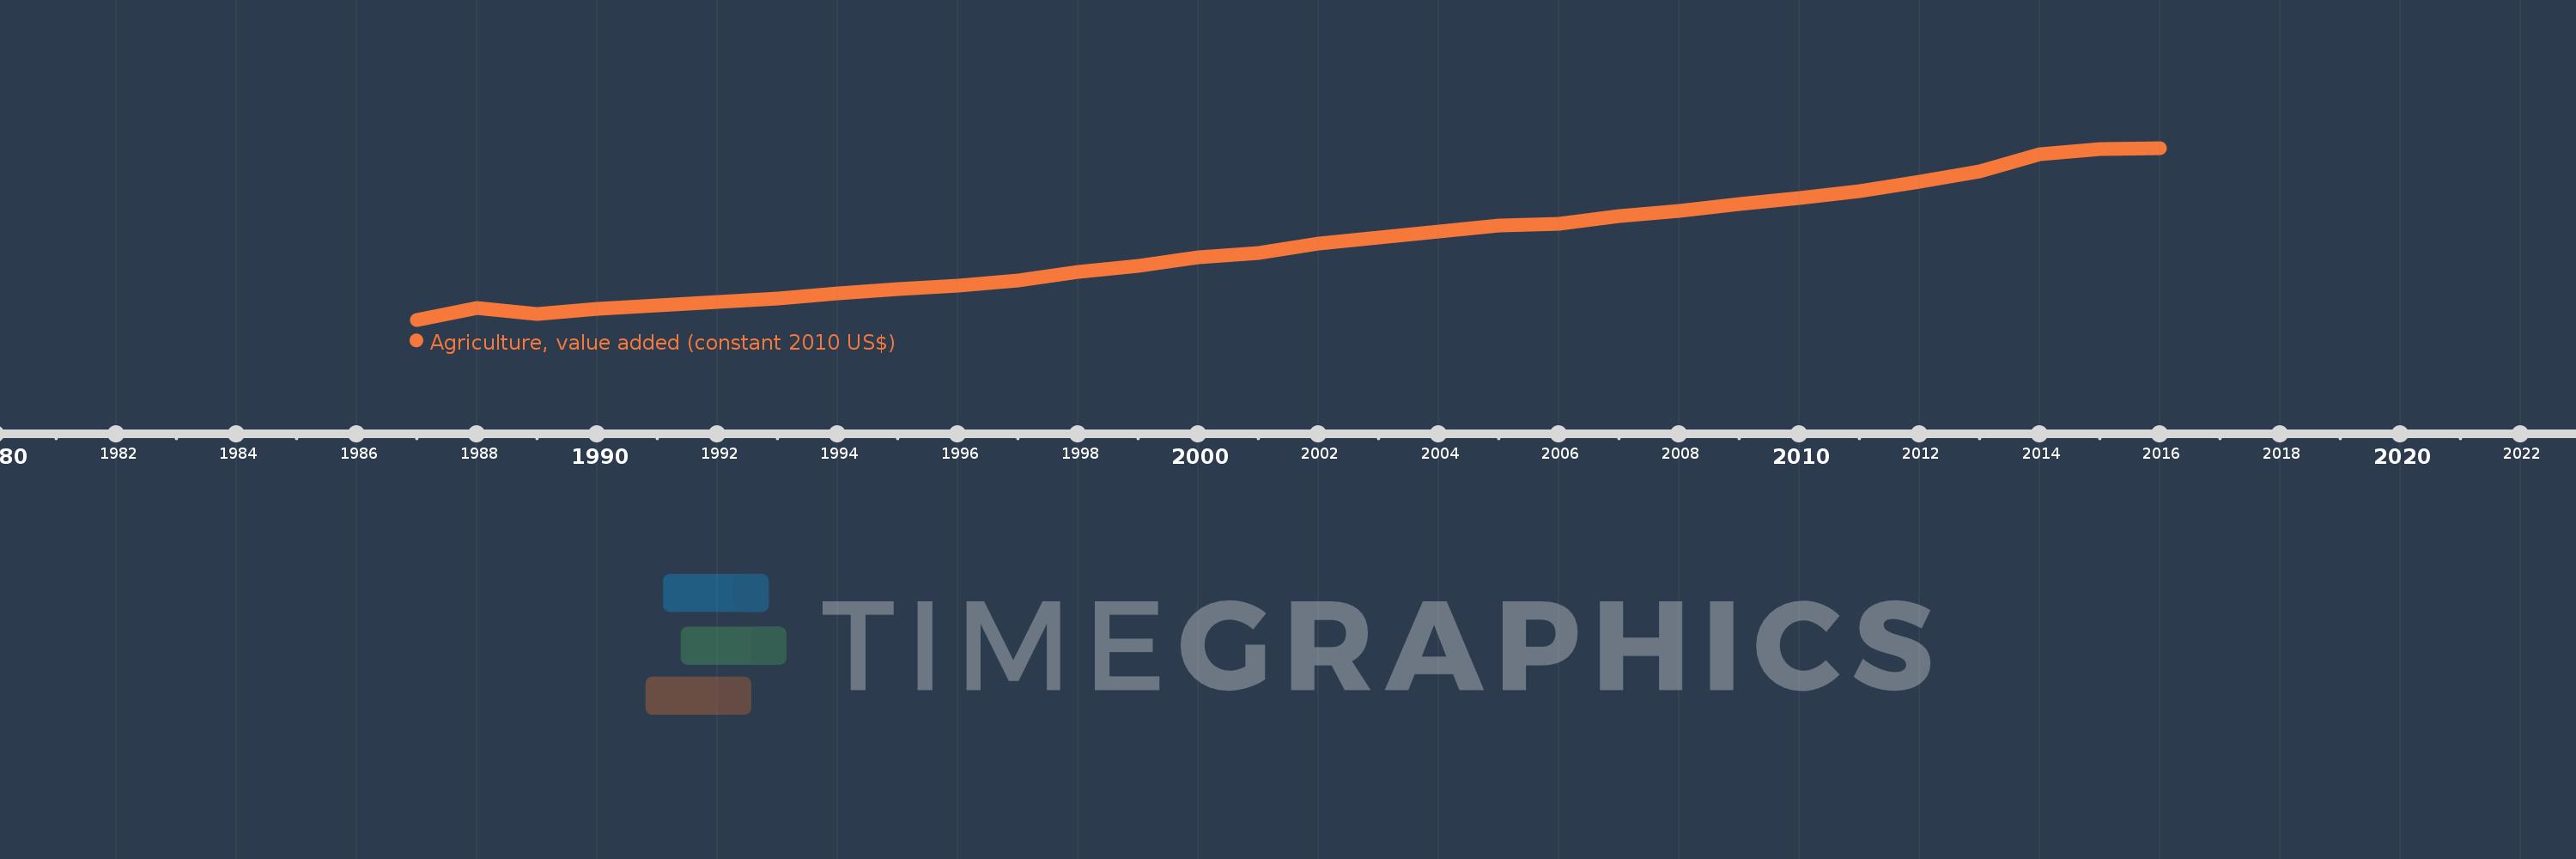
Agriculture, value added (constant 2010 US$)
2016,2015,2014,2013,2012,2011,2010,2009,2008,2007,2006,2005,2004,2003,2002,2001,2000,1999,1998,1997,1996,1995,1994,1993,1992,1991,1990,1989,1988,1987
This statistics in other country:
AfghanistanAlbaniaAlgeriaAndorraAntigua and BarbudaArab WorldArgentinaArmeniaArubaAustraliaAustriaAzerbaijanBahamas, TheBahrainBangladeshBarbadosBelarusBelgiumBelizeBeninBermudaBhutanBoliviaBosnia and HerzegovinaBotswanaBrazilBrunei DarussalamBulgariaBurkina FasoBurundiCabo VerdeCambodiaCameroonCanadaCaribbean small statesCentral African RepublicCentral Europe and the BalticsChadChileChinaColombiaComorosCongo, Dem. Rep.Congo, Rep.Costa RicaCote d'IvoireCroatiaCubaCyprusCzech RepublicDenmarkDominicaDominican RepublicEarly-demographic dividendEast Asia & PacificEast Asia & Pacific (excluding high income)East Asia & Pacific (IDA & IBRD countries)EcuadorEgypt, Arab Rep.El SalvadorEquatorial GuineaEstoniaEthiopiaEuro areaEurope & Central AsiaEurope & Central Asia (excluding high income)Europe & Central Asia (IDA & IBRD countries)European UnionFijiFinlandFragile and conflict affected situationsFranceGabonGambia, TheGeorgiaGermanyGhanaGreeceGrenadaGuatemalaGuineaGuinea-BissauGuyanaHeavily indebted poor countries (HIPC)High incomeHondurasHong Kong SAR, ChinaHungaryIBRD onlyIcelandIDA & IBRD totalIDA blendIDA onlyIDA totalIndiaIndonesiaIran, Islamic Rep.IraqIrelandItalyJamaicaJapanJordanKazakhstanKenyaKiribatiKorea, Rep.KosovoKuwaitKyrgyz RepublicLao PDRLate-demographic dividendLatin America & Caribbean Latin America & Caribbean (excluding high income)Latin America & the Caribbean (IDA & IBRD countries)LatviaLeast developed countries: UN classificationLebanonLesothoLiberiaLithuaniaLow & middle incomeLow incomeLower middle incomeLuxembourgMacao SAR, ChinaMacedonia, FYRMadagascarMalawiMalaysiaMaldivesMaliMaltaMarshall IslandsMauritaniaMauritiusMexicoMicronesia, Fed. Sts.Middle East & North AfricaMiddle East & North Africa (excluding high income)Middle East & North Africa (IDA & IBRD countries)Middle incomeMoldovaMongoliaMontenegroMoroccoMozambiqueMyanmarNamibiaNepalNetherlandsNew ZealandNicaraguaNigerNigeriaNorth AmericaNorwayOECD membersOmanOther small statesPakistanPalauPanamaParaguayPeruPhilippinesPolandPortugalPost-demographic dividendPre-demographic dividendPuerto RicoQatarRomaniaRussian FederationRwandaSamoaSao Tome and PrincipeSaudi ArabiaSenegalSerbiaSeychellesSierra LeoneSingaporeSlovak RepublicSloveniaSmall statesSouth AfricaSouth AsiaSouth Asia (IDA & IBRD)SpainSri LankaSt. Kitts and NevisSt. LuciaSt. Vincent and the GrenadinesSub-Saharan Africa Sub-Saharan Africa (excluding high income)Sub-Saharan Africa (IDA & IBRD countries)SudanSurinameSwazilandSwedenSwitzerlandTajikistanTanzaniaThailandTimor-LesteTogoTongaTrinidad and TobagoTunisiaTurkeyTurkmenistanTuvaluUgandaUkraineUnited Arab EmiratesUnited KingdomUnited StatesUpper middle incomeUruguayUzbekistanVanuatuVenezuela, RBVietnamWest Bank and GazaWorldYemen, Rep.ZambiaZimbabwe Timeline:
This timeline shows a graph from 1987 to 2016 of Guinea. No data until 1986. Number of actual observations by date: 30.
Source name:
World Development Indicators
Source organization:
World Bank national accounts data, and OECD National Accounts data files.
Categories, topics:
Economy & Growth
Last updated:
apr 23, 2017
Indicators value changes by year
Minimum:
378.3 mln
jan 1, 1987
Maximum:
1.155 bln
jan 1, 2016
At the date of observation
Value
Absolute change
Change from previous value
jan 1, 1987
378.3 mln
+378.3 mln
0.0%
jan 1, 1988
430.513 mln
+52.213 mln
13.8%
jan 1, 1989
406.042 mln
-24.471 mln
-5.68%
jan 1, 1990
427.731 mln
+21.689 mln
5.34%
jan 1, 1991
442.233 mln
+14.501 mln
3.39%
jan 1, 1992
457.995 mln
+15.762 mln
3.56%
jan 1, 1993
476.056 mln
+18.061 mln
3.94%
jan 1, 1994
496.152 mln
+20.096 mln
4.22%
jan 1, 1995
517.762 mln
+21.61 mln
4.36%
jan 1, 1996
533.574 mln
+15.812 mln
3.05%
jan 1, 1997
556.608 mln
+23.034 mln
4.32%
jan 1, 1998
592.666 mln
+36.058 mln
6.48%
jan 1, 1999
620.111 mln
+27.446 mln
4.63%
jan 1, 2000
661.071 mln
+40.96 mln
6.61%
jan 1, 2001
680.55 mln
+19.479 mln
2.95%
jan 1, 2002
720.881 mln
+40.33 mln
5.93%
jan 1, 2003
751.238 mln
+30.357 mln
4.21%
jan 1, 2004
777.728 mln
+26.491 mln
3.53%
jan 1, 2005
802.672 mln
+24.944 mln
3.21%
jan 1, 2006
813.426 mln
+10.754 mln
1.34%
jan 1, 2007
845.211 mln
+31.786 mln
3.91%
jan 1, 2008
868.882 mln
+23.67 mln
2.8%
jan 1, 2009
900.155 mln
+31.274 mln
3.6%
jan 1, 2010
929.221 mln
+29.066 mln
3.23%
jan 1, 2011
958.871 mln
+29.65 mln
3.19%
jan 1, 2012
1.004 bln
+44.651 mln
4.66%
jan 1, 2013
1.047 bln
+43.627 mln
4.35%
jan 1, 2014
1.125 bln
+77.688 mln
7.42%
jan 1, 2015
1.148 bln
+23.525 mln
2.09%
jan 1, 2016
1.155 bln
+6.565 mln
0.57%
Ranking of countries by current statistics by years


Comments: