29
/
en
AIzaSyAYiBZKx7MnpbEhh9jyipgxe19OcubqV5w
April 1, 2024
130086
Ethiopia
ETH
true
2
1
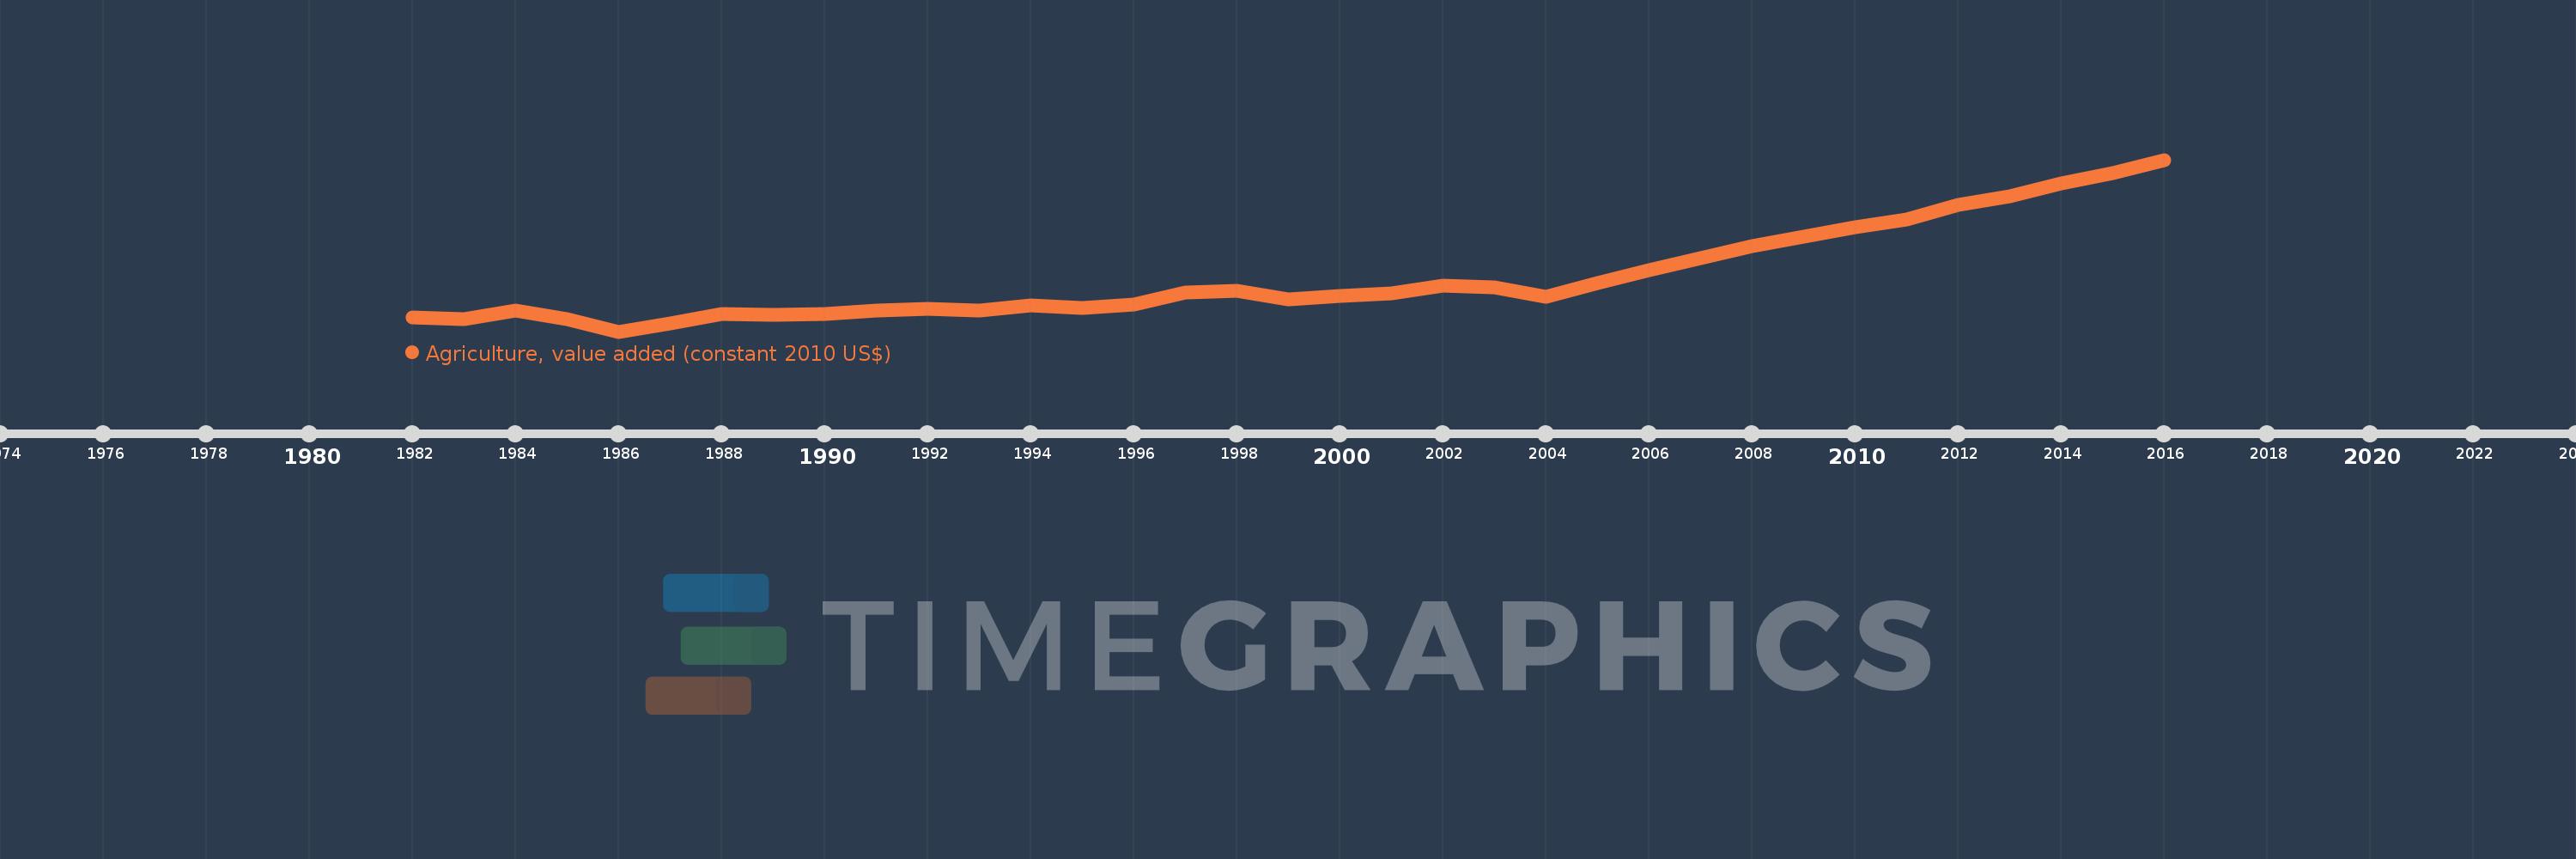
Agriculture, value added (constant 2010 US$)
2016,2015,2014,2013,2012,2011,2010,2009,2008,2007,2006,2005,2004,2003,2002,2001,2000,1999,1998,1997,1996,1995,1994,1993,1992,1991,1990,1989,1988,1987,1986,1985,1984,1983,1982
This statistics in other country:
AfghanistanAlbaniaAlgeriaAndorraAntigua and BarbudaArab WorldArgentinaArmeniaArubaAustraliaAustriaAzerbaijanBahamas, TheBahrainBangladeshBarbadosBelarusBelgiumBelizeBeninBermudaBhutanBoliviaBosnia and HerzegovinaBotswanaBrazilBrunei DarussalamBulgariaBurkina FasoBurundiCabo VerdeCambodiaCameroonCanadaCaribbean small statesCentral African RepublicCentral Europe and the BalticsChadChileChinaColombiaComorosCongo, Dem. Rep.Congo, Rep.Costa RicaCote d'IvoireCroatiaCubaCyprusCzech RepublicDenmarkDominicaDominican RepublicEarly-demographic dividendEast Asia & PacificEast Asia & Pacific (excluding high income)East Asia & Pacific (IDA & IBRD countries)EcuadorEgypt, Arab Rep.El SalvadorEquatorial GuineaEstoniaEthiopiaEuro areaEurope & Central AsiaEurope & Central Asia (excluding high income)Europe & Central Asia (IDA & IBRD countries)European UnionFijiFinlandFragile and conflict affected situationsFranceGabonGambia, TheGeorgiaGermanyGhanaGreeceGrenadaGuatemalaGuineaGuinea-BissauGuyanaHeavily indebted poor countries (HIPC)High incomeHondurasHong Kong SAR, ChinaHungaryIBRD onlyIcelandIDA & IBRD totalIDA blendIDA onlyIDA totalIndiaIndonesiaIran, Islamic Rep.IraqIrelandItalyJamaicaJapanJordanKazakhstanKenyaKiribatiKorea, Rep.KosovoKuwaitKyrgyz RepublicLao PDRLate-demographic dividendLatin America & Caribbean Latin America & Caribbean (excluding high income)Latin America & the Caribbean (IDA & IBRD countries)LatviaLeast developed countries: UN classificationLebanonLesothoLiberiaLithuaniaLow & middle incomeLow incomeLower middle incomeLuxembourgMacao SAR, ChinaMacedonia, FYRMadagascarMalawiMalaysiaMaldivesMaliMaltaMarshall IslandsMauritaniaMauritiusMexicoMicronesia, Fed. Sts.Middle East & North AfricaMiddle East & North Africa (excluding high income)Middle East & North Africa (IDA & IBRD countries)Middle incomeMoldovaMongoliaMontenegroMoroccoMozambiqueMyanmarNamibiaNepalNetherlandsNew ZealandNicaraguaNigerNigeriaNorth AmericaNorwayOECD membersOmanOther small statesPakistanPalauPanamaParaguayPeruPhilippinesPolandPortugalPost-demographic dividendPre-demographic dividendPuerto RicoQatarRomaniaRussian FederationRwandaSamoaSao Tome and PrincipeSaudi ArabiaSenegalSerbiaSeychellesSierra LeoneSingaporeSlovak RepublicSloveniaSmall statesSouth AfricaSouth AsiaSouth Asia (IDA & IBRD)SpainSri LankaSt. Kitts and NevisSt. LuciaSt. Vincent and the GrenadinesSub-Saharan Africa Sub-Saharan Africa (excluding high income)Sub-Saharan Africa (IDA & IBRD countries)SudanSurinameSwazilandSwedenSwitzerlandTajikistanTanzaniaThailandTimor-LesteTogoTongaTrinidad and TobagoTunisiaTurkeyTurkmenistanTuvaluUgandaUkraineUnited Arab EmiratesUnited KingdomUnited StatesUpper middle incomeUruguayUzbekistanVanuatuVenezuela, RBVietnamWest Bank and GazaWorldYemen, Rep.ZambiaZimbabwe Timeline:
This timeline shows a graph from 1982 to 2016 of Ethiopia. No data until 1981. Number of actual observations by date: 35.
Source name:
World Development Indicators
Source organization:
World Bank national accounts data, and OECD National Accounts data files.
Categories, topics:
Economy & Growth
Last updated:
apr 23, 2017
Indicators value changes by year
Minimum:
3.714 bln
jan 1, 1986
Maximum:
17.051 bln
jan 1, 2016
At the date of observation
Value
Absolute change
Change from previous value
jan 1, 1982
4.828 bln
+4.828 bln
0.0%
jan 1, 1983
4.676 bln
-151.629 mln
-3.14%
jan 1, 1984
5.334 bln
+657.265 mln
14.05%
jan 1, 1985
4.673 bln
-660.826 mln
-12.39%
jan 1, 1986
3.714 bln
-959.254 mln
-20.53%
jan 1, 1987
4.327 bln
+613.427 mln
16.52%
jan 1, 1988
5.079 bln
+752.096 mln
17.38%
jan 1, 1989
5.006 bln
-73.266 mln
-1.44%
jan 1, 1990
5.053 bln
+46.871 mln
0.94%
jan 1, 1991
5.327 bln
+274.123 mln
5.43%
jan 1, 1992
5.459 bln
+131.691 mln
2.47%
jan 1, 1993
5.373 bln
-85.505 mln
-1.57%
jan 1, 1994
5.727 bln
+353.918 mln
6.59%
jan 1, 1995
5.579 bln
-147.745 mln
-2.58%
jan 1, 1996
5.789 bln
+210.152 mln
3.77%
jan 1, 1997
6.771 bln
+981.991 mln
16.96%
jan 1, 1998
6.907 bln
+135.572 mln
2.0%
jan 1, 1999
6.241 bln
-665.85 mln
-9.64%
jan 1, 2000
6.453 bln
+212.057 mln
3.4%
jan 1, 2001
6.65 bln
+197.025 mln
3.05%
jan 1, 2002
7.29 bln
+640.031 mln
9.62%
jan 1, 2003
7.153 bln
-136.731 mln
-1.88%
jan 1, 2004
6.403 bln
-750.031 mln
-10.48%
jan 1, 2005
7.488 bln
+1.085 bln
16.94%
jan 1, 2006
8.503 bln
+1.014 bln
13.54%
jan 1, 2007
9.43 bln
+927.533 mln
10.91%
jan 1, 2008
10.321 bln
+890.992 mln
9.45%
jan 1, 2009
11.095 bln
+774.239 mln
7.5%
jan 1, 2010
11.801 bln
+705.774 mln
6.36%
jan 1, 2011
12.407 bln
+605.436 mln
5.13%
jan 1, 2012
13.525 bln
+1.118 bln
9.01%
jan 1, 2013
14.191 bln
+665.717 mln
4.92%
jan 1, 2014
15.198 bln
+1.007 bln
7.1%
jan 1, 2015
16.026 bln
+827.799 mln
5.45%
jan 1, 2016
17.051 bln
+1.025 bln
6.39%
Ranking of countries by current statistics by years


Comments: