29
/
en
AIzaSyAYiBZKx7MnpbEhh9jyipgxe19OcubqV5w
April 1, 2024
173782
Lao PDR
LAO
true
2
1
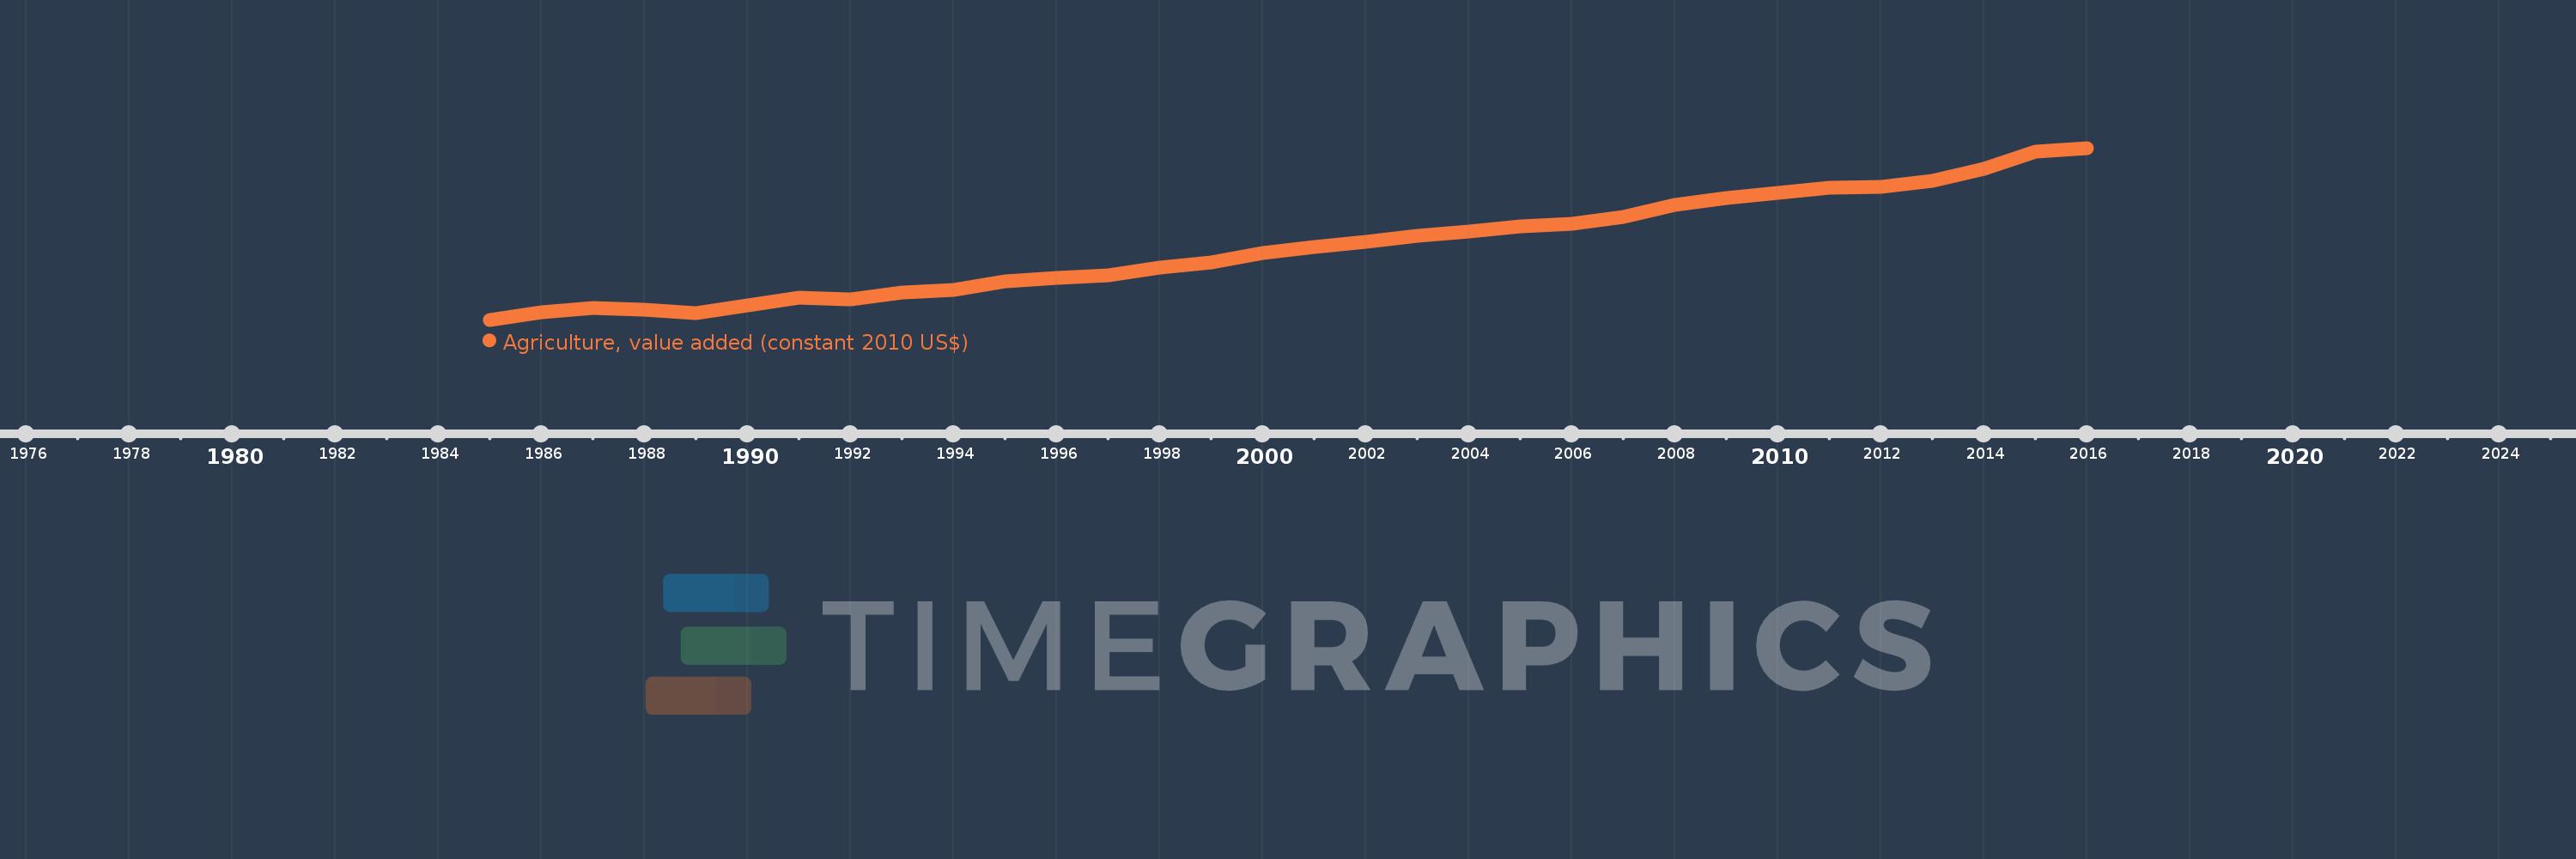
Agriculture, value added (constant 2010 US$)
2016,2015,2014,2013,2012,2011,2010,2009,2008,2007,2006,2005,2004,2003,2002,2001,2000,1999,1998,1997,1996,1995,1994,1993,1992,1991,1990,1989,1988,1987,1986,1985
This statistics in other country:
AfghanistanAlbaniaAlgeriaAndorraAntigua and BarbudaArab WorldArgentinaArmeniaArubaAustraliaAustriaAzerbaijanBahamas, TheBahrainBangladeshBarbadosBelarusBelgiumBelizeBeninBermudaBhutanBoliviaBosnia and HerzegovinaBotswanaBrazilBrunei DarussalamBulgariaBurkina FasoBurundiCabo VerdeCambodiaCameroonCanadaCaribbean small statesCentral African RepublicCentral Europe and the BalticsChadChileChinaColombiaComorosCongo, Dem. Rep.Congo, Rep.Costa RicaCote d'IvoireCroatiaCubaCyprusCzech RepublicDenmarkDominicaDominican RepublicEarly-demographic dividendEast Asia & PacificEast Asia & Pacific (excluding high income)East Asia & Pacific (IDA & IBRD countries)EcuadorEgypt, Arab Rep.El SalvadorEquatorial GuineaEstoniaEthiopiaEuro areaEurope & Central AsiaEurope & Central Asia (excluding high income)Europe & Central Asia (IDA & IBRD countries)European UnionFijiFinlandFragile and conflict affected situationsFranceGabonGambia, TheGeorgiaGermanyGhanaGreeceGrenadaGuatemalaGuineaGuinea-BissauGuyanaHeavily indebted poor countries (HIPC)High incomeHondurasHong Kong SAR, ChinaHungaryIBRD onlyIcelandIDA & IBRD totalIDA blendIDA onlyIDA totalIndiaIndonesiaIran, Islamic Rep.IraqIrelandItalyJamaicaJapanJordanKazakhstanKenyaKiribatiKorea, Rep.KosovoKuwaitKyrgyz RepublicLao PDRLate-demographic dividendLatin America & Caribbean Latin America & Caribbean (excluding high income)Latin America & the Caribbean (IDA & IBRD countries)LatviaLeast developed countries: UN classificationLebanonLesothoLiberiaLithuaniaLow & middle incomeLow incomeLower middle incomeLuxembourgMacao SAR, ChinaMacedonia, FYRMadagascarMalawiMalaysiaMaldivesMaliMaltaMarshall IslandsMauritaniaMauritiusMexicoMicronesia, Fed. Sts.Middle East & North AfricaMiddle East & North Africa (excluding high income)Middle East & North Africa (IDA & IBRD countries)Middle incomeMoldovaMongoliaMontenegroMoroccoMozambiqueMyanmarNamibiaNepalNetherlandsNew ZealandNicaraguaNigerNigeriaNorth AmericaNorwayOECD membersOmanOther small statesPakistanPalauPanamaParaguayPeruPhilippinesPolandPortugalPost-demographic dividendPre-demographic dividendPuerto RicoQatarRomaniaRussian FederationRwandaSamoaSao Tome and PrincipeSaudi ArabiaSenegalSerbiaSeychellesSierra LeoneSingaporeSlovak RepublicSloveniaSmall statesSouth AfricaSouth AsiaSouth Asia (IDA & IBRD)SpainSri LankaSt. Kitts and NevisSt. LuciaSt. Vincent and the GrenadinesSub-Saharan Africa Sub-Saharan Africa (excluding high income)Sub-Saharan Africa (IDA & IBRD countries)SudanSurinameSwazilandSwedenSwitzerlandTajikistanTanzaniaThailandTimor-LesteTogoTongaTrinidad and TobagoTunisiaTurkeyTurkmenistanTuvaluUgandaUkraineUnited Arab EmiratesUnited KingdomUnited StatesUpper middle incomeUruguayUzbekistanVanuatuVenezuela, RBVietnamWest Bank and GazaWorldYemen, Rep.ZambiaZimbabwe Timeline:
This timeline shows a graph from 1985 to 2016 of Lao PDR. No data until 1984. Number of actual observations by date: 32.
Source name:
World Development Indicators
Source organization:
World Bank national accounts data, and OECD National Accounts data files.
Categories, topics:
Economy & Growth
Last updated:
apr 23, 2017
Indicators value changes by year
Minimum:
718.961 mln
jan 1, 1985
Maximum:
2.533 bln
jan 1, 2016
At the date of observation
Value
Absolute change
Change from previous value
jan 1, 1985
718.961 mln
+718.961 mln
0.0%
jan 1, 1986
798.363 mln
+79.402 mln
11.04%
jan 1, 1987
839.213 mln
+40.85 mln
5.12%
jan 1, 1988
823.129 mln
-16.085 mln
-1.92%
jan 1, 1989
788.661 mln
-34.467 mln
-4.19%
jan 1, 1990
873.68 mln
+85.019 mln
10.78%
jan 1, 1991
949.253 mln
+75.573 mln
8.65%
jan 1, 1992
932.658 mln
-16.595 mln
-1.75%
jan 1, 1993
1.01 bln
+77.104 mln
8.27%
jan 1, 1994
1.037 bln
+27.318 mln
2.71%
jan 1, 1995
1.123 bln
+86.04 mln
8.3%
jan 1, 1996
1.158 bln
+35.31 mln
3.14%
jan 1, 1997
1.189 bln
+30.561 mln
2.64%
jan 1, 1998
1.273 bln
+84.21 mln
7.08%
jan 1, 1999
1.32 bln
+46.766 mln
3.67%
jan 1, 2000
1.42 bln
+100.079 mln
7.58%
jan 1, 2001
1.49 bln
+69.959 mln
4.93%
jan 1, 2002
1.546 bln
+56.169 mln
3.77%
jan 1, 2003
1.608 bln
+61.53 mln
3.98%
jan 1, 2004
1.648 bln
+40.365 mln
2.51%
jan 1, 2005
1.704 bln
+56.408 mln
3.42%
jan 1, 2006
1.729 bln
+24.121 mln
1.42%
jan 1, 2007
1.8 bln
+71.863 mln
4.16%
jan 1, 2008
1.934 bln
+133.32 mln
7.4%
jan 1, 2009
2.001 bln
+66.876 mln
3.46%
jan 1, 2010
2.057 bln
+56.616 mln
2.83%
jan 1, 2011
2.115 bln
+57.461 mln
2.79%
jan 1, 2012
2.125 bln
+10.313 mln
0.49%
jan 1, 2013
2.184 bln
+58.521 mln
2.75%
jan 1, 2014
2.313 bln
+129.0 mln
5.91%
jan 1, 2015
2.498 bln
+185.812 mln
8.03%
jan 1, 2016
2.533 bln
+34.956 mln
1.4%
Ranking of countries by current statistics by years


Comments: