29
/
en
AIzaSyAYiBZKx7MnpbEhh9jyipgxe19OcubqV5w
April 1, 2024
186150
Malawi
MWI
true
2
1
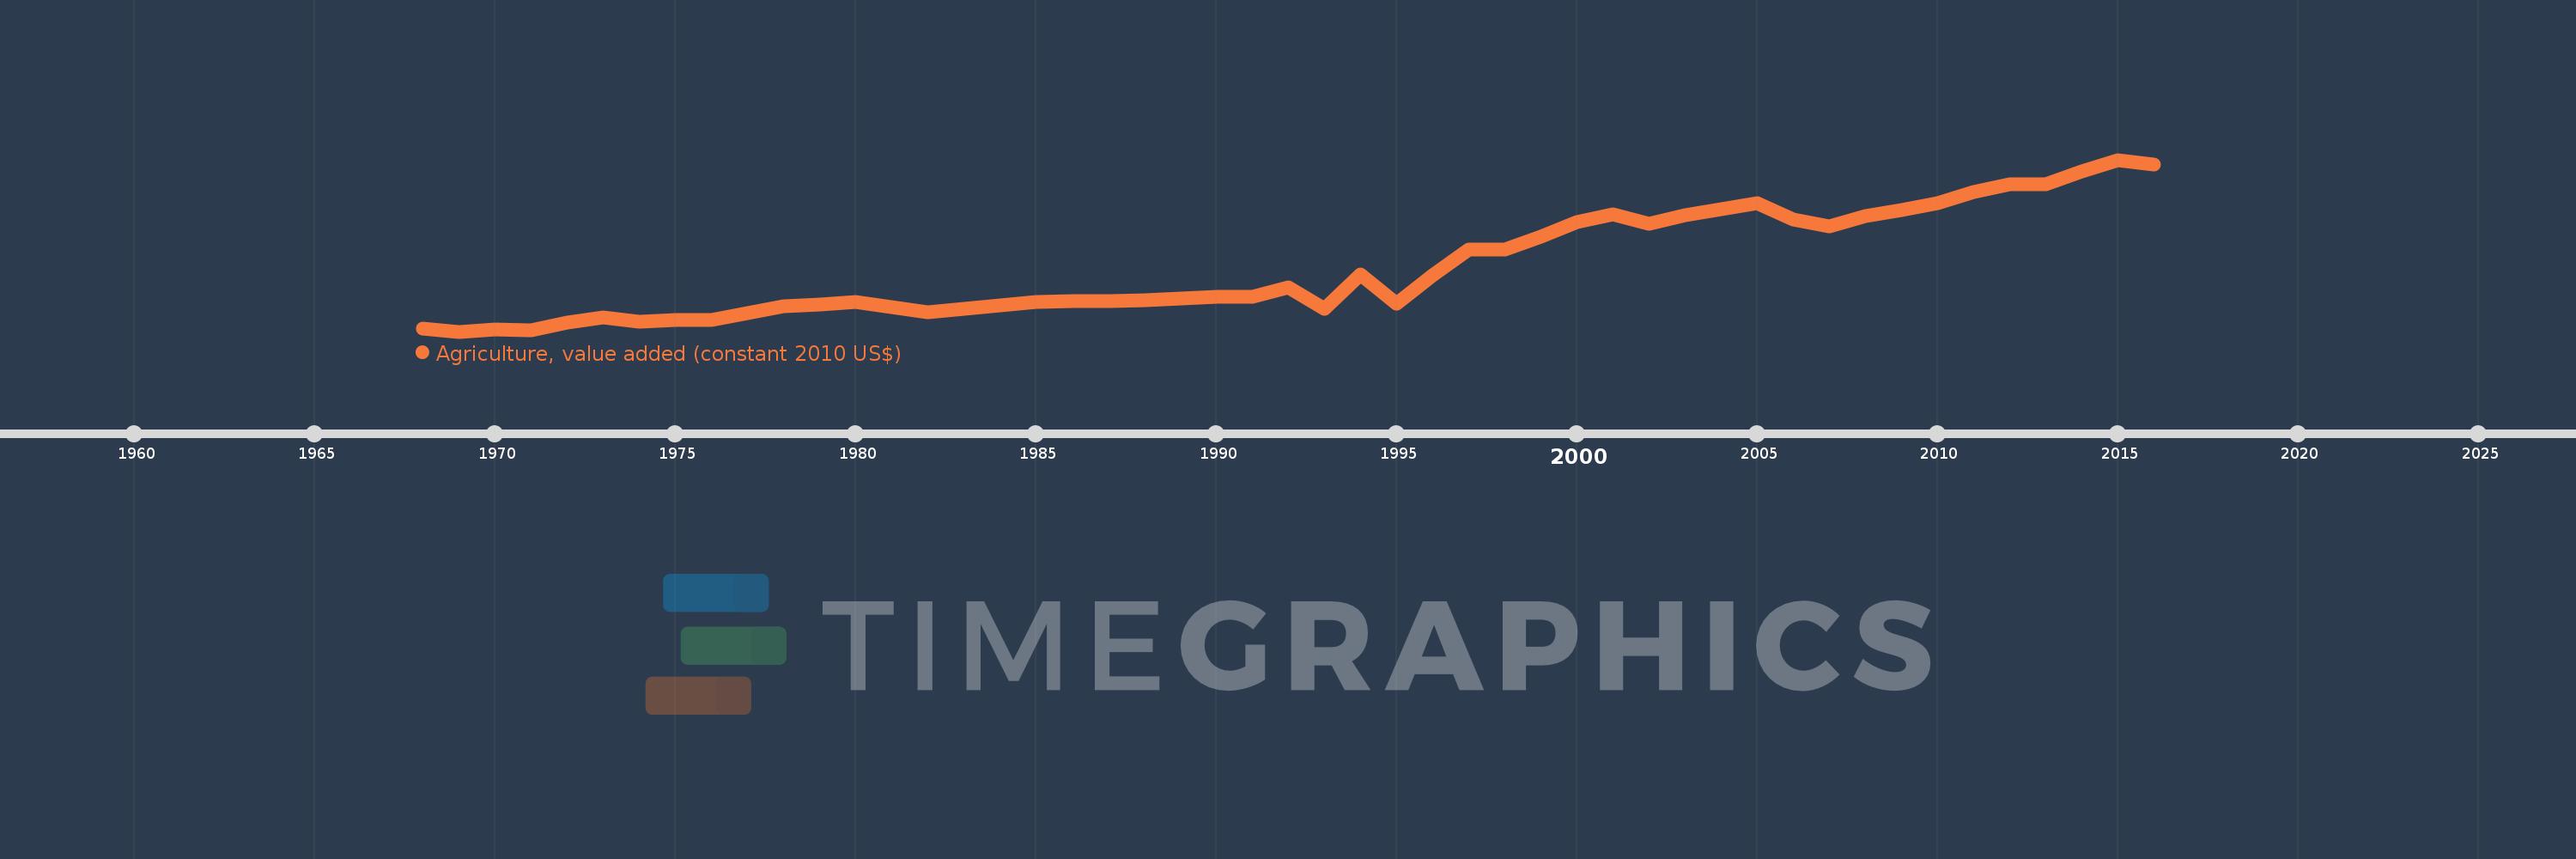
Agriculture, value added (constant 2010 US$)
2016,2015,2014,2013,2012,2011,2010,2009,2008,2007,2006,2005,2004,2003,2002,2001,2000,1999,1998,1997,1996,1995,1994,1993,1992,1991,1990,1989,1988,1987,1986,1985,1984,1983,1982,1981,1980,1979,1978,1977,1976,1975,1974,1973,1972,1971,1970,1969,1968
This statistics in other country:
AfghanistanAlbaniaAlgeriaAndorraAntigua and BarbudaArab WorldArgentinaArmeniaArubaAustraliaAustriaAzerbaijanBahamas, TheBahrainBangladeshBarbadosBelarusBelgiumBelizeBeninBermudaBhutanBoliviaBosnia and HerzegovinaBotswanaBrazilBrunei DarussalamBulgariaBurkina FasoBurundiCabo VerdeCambodiaCameroonCanadaCaribbean small statesCentral African RepublicCentral Europe and the BalticsChadChileChinaColombiaComorosCongo, Dem. Rep.Congo, Rep.Costa RicaCote d'IvoireCroatiaCubaCyprusCzech RepublicDenmarkDominicaDominican RepublicEarly-demographic dividendEast Asia & PacificEast Asia & Pacific (excluding high income)East Asia & Pacific (IDA & IBRD countries)EcuadorEgypt, Arab Rep.El SalvadorEquatorial GuineaEstoniaEthiopiaEuro areaEurope & Central AsiaEurope & Central Asia (excluding high income)Europe & Central Asia (IDA & IBRD countries)European UnionFijiFinlandFragile and conflict affected situationsFranceGabonGambia, TheGeorgiaGermanyGhanaGreeceGrenadaGuatemalaGuineaGuinea-BissauGuyanaHeavily indebted poor countries (HIPC)High incomeHondurasHong Kong SAR, ChinaHungaryIBRD onlyIcelandIDA & IBRD totalIDA blendIDA onlyIDA totalIndiaIndonesiaIran, Islamic Rep.IraqIrelandItalyJamaicaJapanJordanKazakhstanKenyaKiribatiKorea, Rep.KosovoKuwaitKyrgyz RepublicLao PDRLate-demographic dividendLatin America & Caribbean Latin America & Caribbean (excluding high income)Latin America & the Caribbean (IDA & IBRD countries)LatviaLeast developed countries: UN classificationLebanonLesothoLiberiaLithuaniaLow & middle incomeLow incomeLower middle incomeLuxembourgMacao SAR, ChinaMacedonia, FYRMadagascarMalawiMalaysiaMaldivesMaliMaltaMarshall IslandsMauritaniaMauritiusMexicoMicronesia, Fed. Sts.Middle East & North AfricaMiddle East & North Africa (excluding high income)Middle East & North Africa (IDA & IBRD countries)Middle incomeMoldovaMongoliaMontenegroMoroccoMozambiqueMyanmarNamibiaNepalNetherlandsNew ZealandNicaraguaNigerNigeriaNorth AmericaNorwayOECD membersOmanOther small statesPakistanPalauPanamaParaguayPeruPhilippinesPolandPortugalPost-demographic dividendPre-demographic dividendPuerto RicoQatarRomaniaRussian FederationRwandaSamoaSao Tome and PrincipeSaudi ArabiaSenegalSerbiaSeychellesSierra LeoneSingaporeSlovak RepublicSloveniaSmall statesSouth AfricaSouth AsiaSouth Asia (IDA & IBRD)SpainSri LankaSt. Kitts and NevisSt. LuciaSt. Vincent and the GrenadinesSub-Saharan Africa Sub-Saharan Africa (excluding high income)Sub-Saharan Africa (IDA & IBRD countries)SudanSurinameSwazilandSwedenSwitzerlandTajikistanTanzaniaThailandTimor-LesteTogoTongaTrinidad and TobagoTunisiaTurkeyTurkmenistanTuvaluUgandaUkraineUnited Arab EmiratesUnited KingdomUnited StatesUpper middle incomeUruguayUzbekistanVanuatuVenezuela, RBVietnamWest Bank and GazaWorldYemen, Rep.ZambiaZimbabwe Timeline:
This timeline shows a graph from 1968 to 2016 of Malawi. No data until 1967. Number of actual observations by date: 49.
Source name:
World Development Indicators
Source organization:
World Bank national accounts data, and OECD National Accounts data files.
Categories, topics:
Economy & Growth
Last updated:
apr 23, 2017
Indicators value changes by year
Minimum:
488.358 mln
jan 1, 1969
Maximum:
2.422 bln
jan 1, 2015
At the date of observation
Value
Absolute change
Change from previous value
jan 1, 1968
521.509 mln
+521.509 mln
0.0%
jan 1, 1969
488.358 mln
-33.15 mln
-6.36%
jan 1, 1970
508.842 mln
+20.483 mln
4.19%
jan 1, 1971
502.104 mln
-6.738 mln
-1.32%
jan 1, 1972
586.731 mln
+84.627 mln
16.85%
jan 1, 1973
643.059 mln
+56.328 mln
9.6%
jan 1, 1974
602.632 mln
-40.427 mln
-6.29%
jan 1, 1975
615.03 mln
+12.398 mln
2.06%
jan 1, 1976
620.69 mln
+5.66 mln
0.92%
jan 1, 1977
694.267 mln
+73.577 mln
11.85%
jan 1, 1978
772.156 mln
+77.889 mln
11.22%
jan 1, 1979
794.795 mln
+22.639 mln
2.93%
jan 1, 1980
819.591 mln
+24.795 mln
3.12%
jan 1, 1981
765.957 mln
-53.633 mln
-6.54%
jan 1, 1982
703.161 mln
-62.797 mln
-8.2%
jan 1, 1983
748.17 mln
+45.009 mln
6.4%
jan 1, 1984
781.32 mln
+33.15 mln
4.43%
jan 1, 1985
826.059 mln
+44.739 mln
5.73%
jan 1, 1986
830.102 mln
+4.043 mln
0.49%
jan 1, 1987
835.222 mln
+5.121 mln
0.62%
jan 1, 1988
842.23 mln
+7.007 mln
0.84%
jan 1, 1989
859.209 mln
+16.979 mln
2.02%
jan 1, 1990
880.231 mln
+21.022 mln
2.45%
jan 1, 1991
878.075 mln
-2.156 mln
-0.24%
jan 1, 1992
990.462 mln
+112.387 mln
12.8%
jan 1, 1993
741.701 mln
-248.761 mln
-25.12%
jan 1, 1994
1.135 bln
+392.951 mln
52.98%
jan 1, 1995
806.501 mln
-328.151 mln
-28.92%
jan 1, 1996
1.126 bln
+319.296 mln
39.59%
jan 1, 1997
1.413 bln
+287.161 mln
25.51%
jan 1, 1998
1.415 bln
+1.893 mln
0.13%
jan 1, 1999
1.561 bln
+146.286 mln
10.34%
jan 1, 2000
1.719 bln
+157.912 mln
10.12%
jan 1, 2001
1.81 bln
+91.09 mln
5.3%
jan 1, 2002
1.702 bln
-108.295 mln
-5.98%
jan 1, 2003
1.802 bln
+100.3 mln
5.89%
jan 1, 2004
1.862 bln
+59.617 mln
3.31%
jan 1, 2005
1.93 bln
+67.845 mln
3.64%
jan 1, 2006
1.75 bln
-180.037 mln
-9.33%
jan 1, 2007
1.669 bln
-80.84 mln
-4.62%
jan 1, 2008
1.792 bln
+123.333 mln
7.39%
jan 1, 2009
1.855 bln
+62.998 mln
3.52%
jan 1, 2010
1.929 bln
+74.122 mln
4.0%
jan 1, 2011
2.06 bln
+131.258 mln
6.8%
jan 1, 2012
2.149 bln
+88.33 mln
4.29%
jan 1, 2013
2.146 bln
-2.681 mln
-0.12%
jan 1, 2014
2.287 bln
+141.278 mln
6.58%
jan 1, 2015
2.422 bln
+134.685 mln
5.89%
jan 1, 2016
2.373 bln
-48.859 mln
-2.02%
Ranking of countries by current statistics by years


Comments: