29
/
en
AIzaSyAYiBZKx7MnpbEhh9jyipgxe19OcubqV5w
April 1, 2024
55320
Pre-demographic dividend
PRE
false
2
1
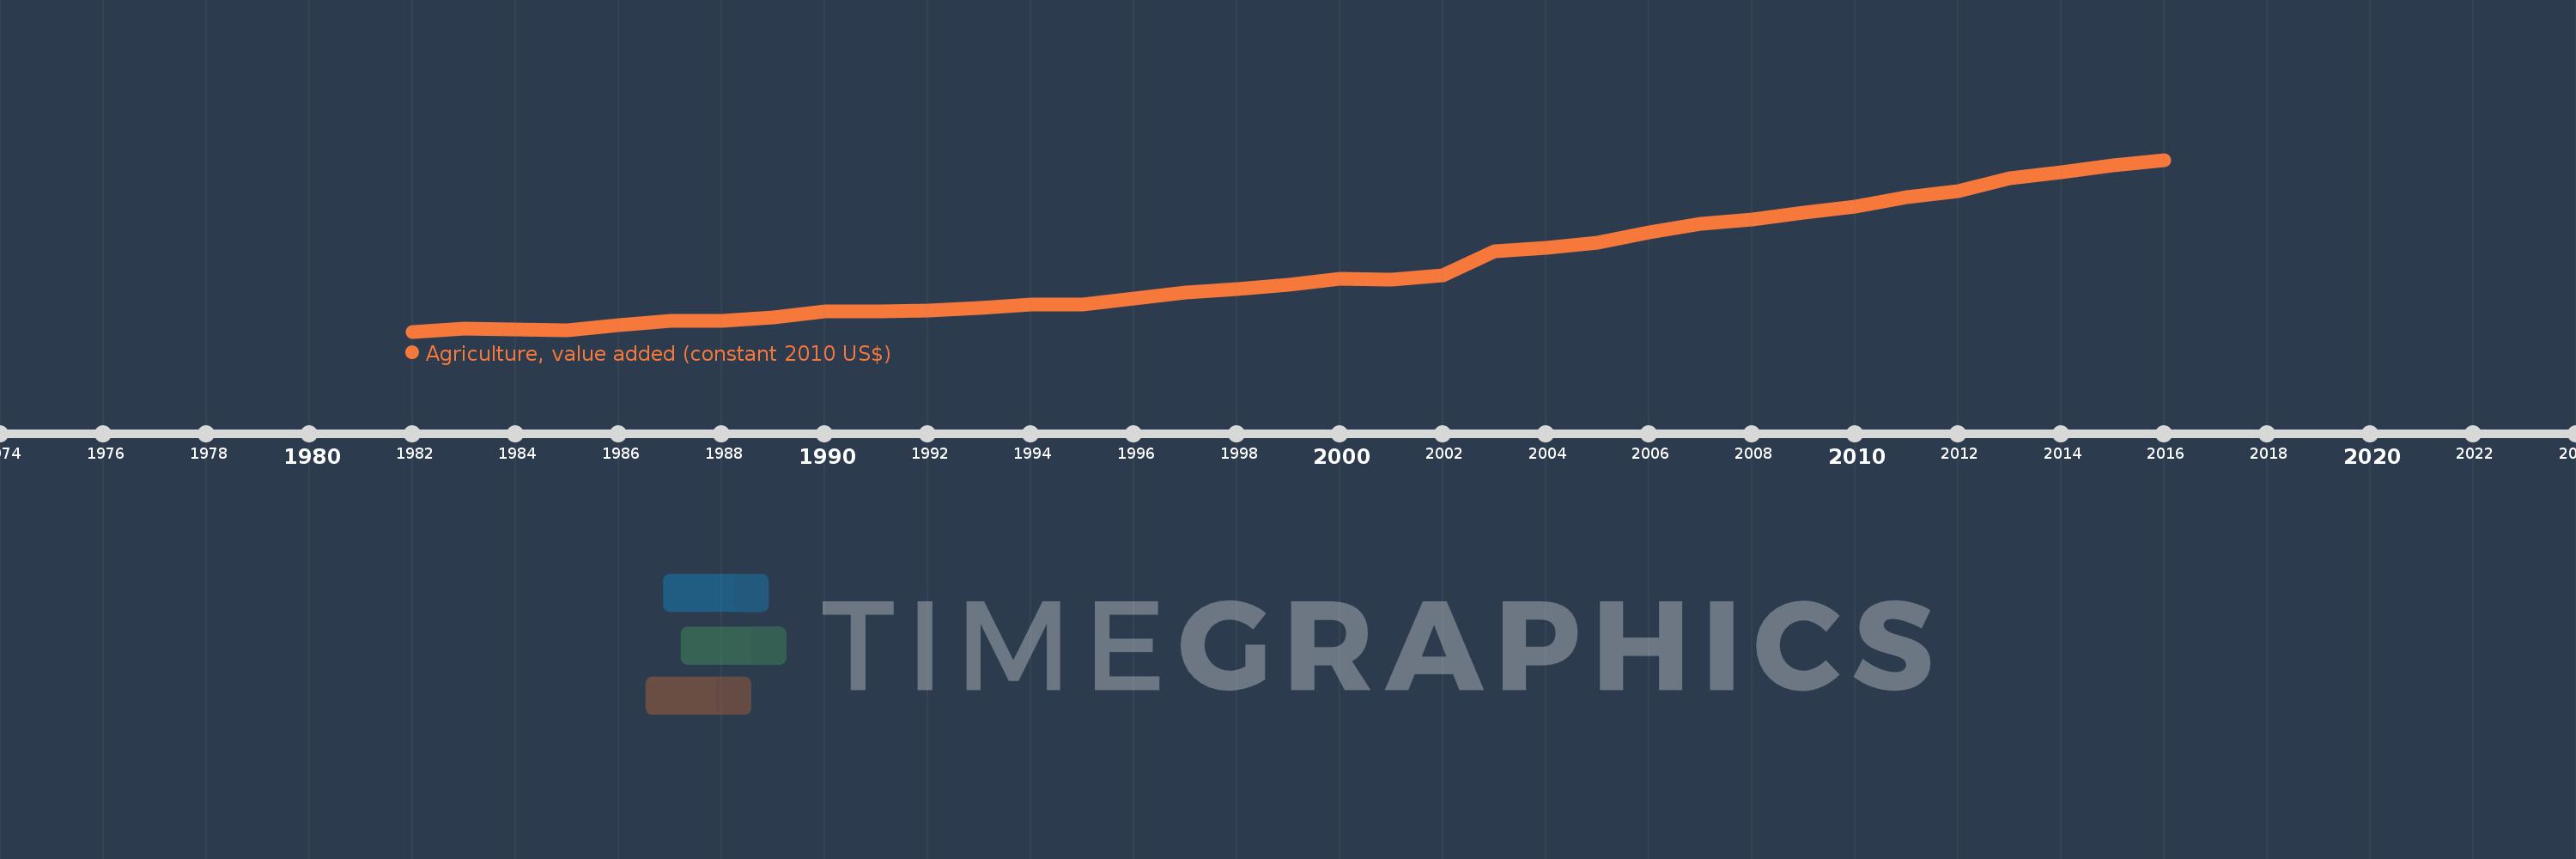
Agriculture, value added (constant 2010 US$)
2016,2015,2014,2013,2012,2011,2010,2009,2008,2007,2006,2005,2004,2003,2002,2001,2000,1999,1998,1997,1996,1995,1994,1993,1992,1991,1990,1989,1988,1987,1986,1985,1984,1983,1982
This statistics in other country:
AfghanistanAlbaniaAlgeriaAndorraAntigua and BarbudaArab WorldArgentinaArmeniaArubaAustraliaAustriaAzerbaijanBahamas, TheBahrainBangladeshBarbadosBelarusBelgiumBelizeBeninBermudaBhutanBoliviaBosnia and HerzegovinaBotswanaBrazilBrunei DarussalamBulgariaBurkina FasoBurundiCabo VerdeCambodiaCameroonCanadaCaribbean small statesCentral African RepublicCentral Europe and the BalticsChadChileChinaColombiaComorosCongo, Dem. Rep.Congo, Rep.Costa RicaCote d'IvoireCroatiaCubaCyprusCzech RepublicDenmarkDominicaDominican RepublicEarly-demographic dividendEast Asia & PacificEast Asia & Pacific (excluding high income)East Asia & Pacific (IDA & IBRD countries)EcuadorEgypt, Arab Rep.El SalvadorEquatorial GuineaEstoniaEthiopiaEuro areaEurope & Central AsiaEurope & Central Asia (excluding high income)Europe & Central Asia (IDA & IBRD countries)European UnionFijiFinlandFragile and conflict affected situationsFranceGabonGambia, TheGeorgiaGermanyGhanaGreeceGrenadaGuatemalaGuineaGuinea-BissauGuyanaHeavily indebted poor countries (HIPC)High incomeHondurasHong Kong SAR, ChinaHungaryIBRD onlyIcelandIDA & IBRD totalIDA blendIDA onlyIDA totalIndiaIndonesiaIran, Islamic Rep.IraqIrelandItalyJamaicaJapanJordanKazakhstanKenyaKiribatiKorea, Rep.KosovoKuwaitKyrgyz RepublicLao PDRLate-demographic dividendLatin America & Caribbean Latin America & Caribbean (excluding high income)Latin America & the Caribbean (IDA & IBRD countries)LatviaLeast developed countries: UN classificationLebanonLesothoLiberiaLithuaniaLow & middle incomeLow incomeLower middle incomeLuxembourgMacao SAR, ChinaMacedonia, FYRMadagascarMalawiMalaysiaMaldivesMaliMaltaMarshall IslandsMauritaniaMauritiusMexicoMicronesia, Fed. Sts.Middle East & North AfricaMiddle East & North Africa (excluding high income)Middle East & North Africa (IDA & IBRD countries)Middle incomeMoldovaMongoliaMontenegroMoroccoMozambiqueMyanmarNamibiaNepalNetherlandsNew ZealandNicaraguaNigerNigeriaNorth AmericaNorwayOECD membersOmanOther small statesPakistanPalauPanamaParaguayPeruPhilippinesPolandPortugalPost-demographic dividendPre-demographic dividendPuerto RicoQatarRomaniaRussian FederationRwandaSamoaSao Tome and PrincipeSaudi ArabiaSenegalSerbiaSeychellesSierra LeoneSingaporeSlovak RepublicSloveniaSmall statesSouth AfricaSouth AsiaSouth Asia (IDA & IBRD)SpainSri LankaSt. Kitts and NevisSt. LuciaSt. Vincent and the GrenadinesSub-Saharan Africa Sub-Saharan Africa (excluding high income)Sub-Saharan Africa (IDA & IBRD countries)SudanSurinameSwazilandSwedenSwitzerlandTajikistanTanzaniaThailandTimor-LesteTogoTongaTrinidad and TobagoTunisiaTurkeyTurkmenistanTuvaluUgandaUkraineUnited Arab EmiratesUnited KingdomUnited StatesUpper middle incomeUruguayUzbekistanVanuatuVenezuela, RBVietnamWest Bank and GazaWorldYemen, Rep.ZambiaZimbabwe Timeline:
This timeline shows a graph from 1982 to 2016 of Pre-demographic dividend. No data until 1981. Number of actual observations by date: 35.
Source name:
World Development Indicators
Source organization:
World Bank national accounts data, and OECD National Accounts data files.
Categories, topics:
Economy & Growth
Last updated:
apr 23, 2017
Indicators value changes by year
Minimum:
63.961 bln
jan 1, 1982
Maximum:
240.089 bln
jan 1, 2016
At the date of observation
Value
Absolute change
Change from previous value
jan 1, 1982
63.961 bln
+63.961 bln
0.0%
jan 1, 1983
67.222 bln
+3.262 bln
5.1%
jan 1, 1984
66.088 bln
-1.135 bln
-1.69%
jan 1, 1985
65.546 bln
-541.372 mln
-0.82%
jan 1, 1986
70.233 bln
+4.687 bln
7.15%
jan 1, 1987
74.839 bln
+4.606 bln
6.56%
jan 1, 1988
75.257 bln
+417.544 mln
0.56%
jan 1, 1989
78.284 bln
+3.027 bln
4.02%
jan 1, 1990
84.507 bln
+6.224 bln
7.95%
jan 1, 1991
84.534 bln
+26.706 mln
0.03%
jan 1, 1992
85.626 bln
+1.092 bln
1.29%
jan 1, 1993
87.873 bln
+2.247 bln
2.62%
jan 1, 1994
91.456 bln
+3.583 bln
4.08%
jan 1, 1995
92.084 bln
+628.457 mln
0.69%
jan 1, 1996
97.828 bln
+5.744 bln
6.24%
jan 1, 1997
103.928 bln
+6.1 bln
6.24%
jan 1, 1998
107.409 bln
+3.481 bln
3.35%
jan 1, 1999
112.062 bln
+4.653 bln
4.33%
jan 1, 2000
118.283 bln
+6.221 bln
5.55%
jan 1, 2001
117.197 bln
-1.086 bln
-0.92%
jan 1, 2002
121.874 bln
+4.678 bln
3.99%
jan 1, 2003
146.541 bln
+24.666 bln
20.24%
jan 1, 2004
149.728 bln
+3.187 bln
2.17%
jan 1, 2005
155.249 bln
+5.522 bln
3.69%
jan 1, 2006
166.064 bln
+10.814 bln
6.97%
jan 1, 2007
174.356 bln
+8.292 bln
4.99%
jan 1, 2008
179.015 bln
+4.659 bln
2.67%
jan 1, 2009
185.612 bln
+6.598 bln
3.69%
jan 1, 2010
192.112 bln
+6.499 bln
3.5%
jan 1, 2011
201.801 bln
+9.69 bln
5.04%
jan 1, 2012
207.838 bln
+6.037 bln
2.99%
jan 1, 2013
220.775 bln
+12.937 bln
6.22%
jan 1, 2014
227.195 bln
+6.42 bln
2.91%
jan 1, 2015
234.697 bln
+7.502 bln
3.3%
jan 1, 2016
240.089 bln
+5.392 bln
2.3%
Ranking of countries by current statistics by years


Comments: