29
/
en
AIzaSyAYiBZKx7MnpbEhh9jyipgxe19OcubqV5w
April 1, 2024
49798
Middle East & North Africa (IDA & IBRD countries)
TMN
false
2
1
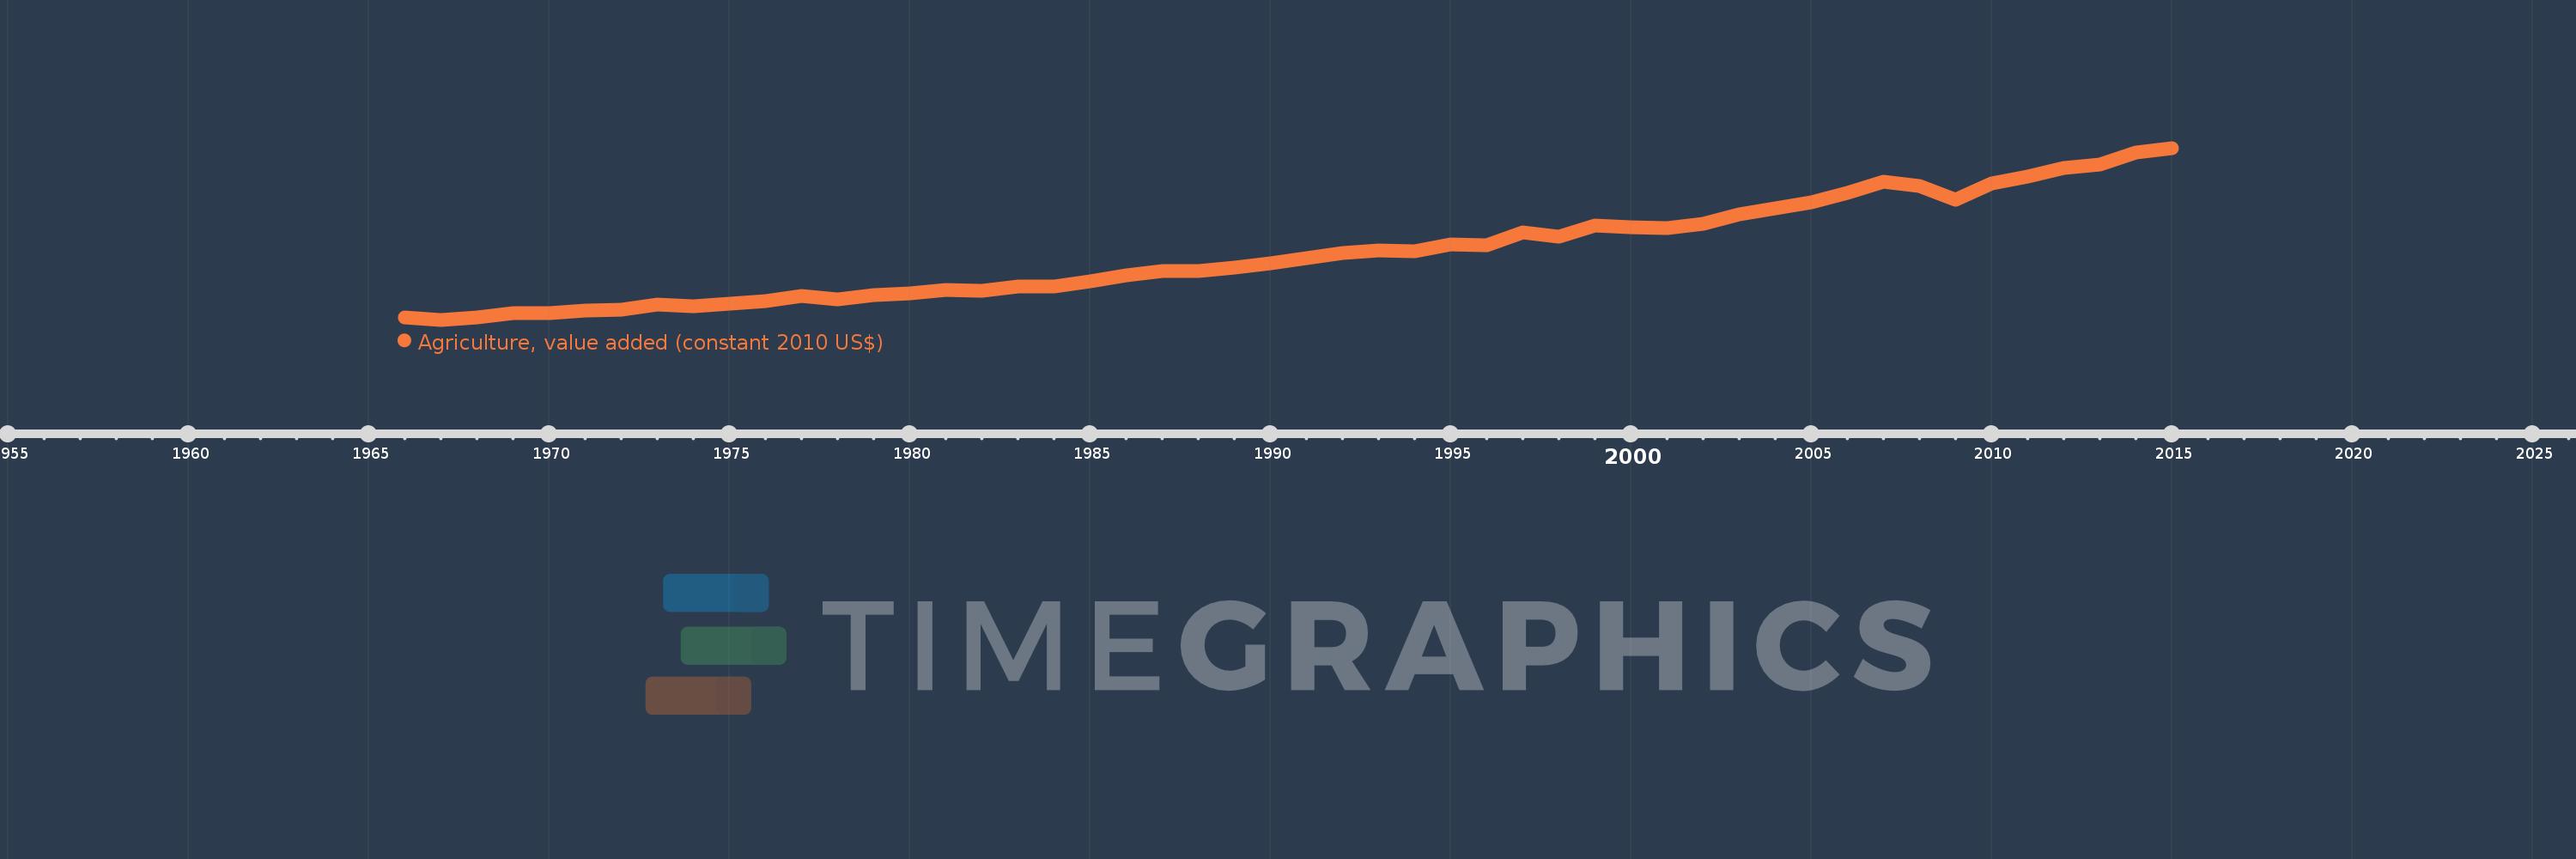
Agriculture, value added (constant 2010 US$)
2015,2014,2013,2012,2011,2010,2009,2008,2007,2006,2005,2004,2003,2002,2001,2000,1999,1998,1997,1996,1995,1994,1993,1992,1991,1990,1989,1988,1987,1986,1985,1984,1983,1982,1981,1980,1979,1978,1977,1976,1975,1974,1973,1972,1971,1970,1969,1968,1967,1966
This statistics in other country:
AfghanistanAlbaniaAlgeriaAndorraAntigua and BarbudaArab WorldArgentinaArmeniaArubaAustraliaAustriaAzerbaijanBahamas, TheBahrainBangladeshBarbadosBelarusBelgiumBelizeBeninBermudaBhutanBoliviaBosnia and HerzegovinaBotswanaBrazilBrunei DarussalamBulgariaBurkina FasoBurundiCabo VerdeCambodiaCameroonCanadaCaribbean small statesCentral African RepublicCentral Europe and the BalticsChadChileChinaColombiaComorosCongo, Dem. Rep.Congo, Rep.Costa RicaCote d'IvoireCroatiaCubaCyprusCzech RepublicDenmarkDominicaDominican RepublicEarly-demographic dividendEast Asia & PacificEast Asia & Pacific (excluding high income)East Asia & Pacific (IDA & IBRD countries)EcuadorEgypt, Arab Rep.El SalvadorEquatorial GuineaEstoniaEthiopiaEuro areaEurope & Central AsiaEurope & Central Asia (excluding high income)Europe & Central Asia (IDA & IBRD countries)European UnionFijiFinlandFragile and conflict affected situationsFranceGabonGambia, TheGeorgiaGermanyGhanaGreeceGrenadaGuatemalaGuineaGuinea-BissauGuyanaHeavily indebted poor countries (HIPC)High incomeHondurasHong Kong SAR, ChinaHungaryIBRD onlyIcelandIDA & IBRD totalIDA blendIDA onlyIDA totalIndiaIndonesiaIran, Islamic Rep.IraqIrelandItalyJamaicaJapanJordanKazakhstanKenyaKiribatiKorea, Rep.KosovoKuwaitKyrgyz RepublicLao PDRLate-demographic dividendLatin America & Caribbean Latin America & Caribbean (excluding high income)Latin America & the Caribbean (IDA & IBRD countries)LatviaLeast developed countries: UN classificationLebanonLesothoLiberiaLithuaniaLow & middle incomeLow incomeLower middle incomeLuxembourgMacao SAR, ChinaMacedonia, FYRMadagascarMalawiMalaysiaMaldivesMaliMaltaMarshall IslandsMauritaniaMauritiusMexicoMicronesia, Fed. Sts.Middle East & North AfricaMiddle East & North Africa (excluding high income)Middle East & North Africa (IDA & IBRD countries)Middle incomeMoldovaMongoliaMontenegroMoroccoMozambiqueMyanmarNamibiaNepalNetherlandsNew ZealandNicaraguaNigerNigeriaNorth AmericaNorwayOECD membersOmanOther small statesPakistanPalauPanamaParaguayPeruPhilippinesPolandPortugalPost-demographic dividendPre-demographic dividendPuerto RicoQatarRomaniaRussian FederationRwandaSamoaSao Tome and PrincipeSaudi ArabiaSenegalSerbiaSeychellesSierra LeoneSingaporeSlovak RepublicSloveniaSmall statesSouth AfricaSouth AsiaSouth Asia (IDA & IBRD)SpainSri LankaSt. Kitts and NevisSt. LuciaSt. Vincent and the GrenadinesSub-Saharan Africa Sub-Saharan Africa (excluding high income)Sub-Saharan Africa (IDA & IBRD countries)SudanSurinameSwazilandSwedenSwitzerlandTajikistanTanzaniaThailandTimor-LesteTogoTongaTrinidad and TobagoTunisiaTurkeyTurkmenistanTuvaluUgandaUkraineUnited Arab EmiratesUnited KingdomUnited StatesUpper middle incomeUruguayUzbekistanVanuatuVenezuela, RBVietnamWest Bank and GazaWorldYemen, Rep.ZambiaZimbabwe Timeline:
This timeline shows a graph from 1966 to 2015 of Middle East & North Africa (IDA & IBRD countries). No data until 1965. Number of actual observations by date: 50.
Source name:
World Development Indicators
Source organization:
World Bank national accounts data, and OECD National Accounts data files.
Categories, topics:
Economy & Growth
Last updated:
apr 23, 2017
Indicators value changes by year
Minimum:
23.44 bln
jan 1, 1967
Maximum:
131.402 bln
jan 1, 2015
At the date of observation
Value
Absolute change
Change from previous value
jan 1, 1966
24.832 bln
+24.832 bln
0.0%
jan 1, 1967
23.44 bln
-1.392 bln
-5.61%
jan 1, 1968
25.027 bln
+1.586 bln
6.77%
jan 1, 1969
27.661 bln
+2.635 bln
10.53%
jan 1, 1970
27.775 bln
+113.557 mln
0.41%
jan 1, 1971
28.952 bln
+1.177 bln
4.24%
jan 1, 1972
29.905 bln
+953.199 mln
3.29%
jan 1, 1973
32.744 bln
+2.838 bln
9.49%
jan 1, 1974
31.775 bln
-968.5 mln
-2.96%
jan 1, 1975
33.625 bln
+1.85 bln
5.82%
jan 1, 1976
35.31 bln
+1.685 bln
5.01%
jan 1, 1977
38.129 bln
+2.819 bln
7.98%
jan 1, 1978
36.205 bln
-1.924 bln
-5.05%
jan 1, 1979
38.962 bln
+2.757 bln
7.61%
jan 1, 1980
40.249 bln
+1.287 bln
3.3%
jan 1, 1981
42.21 bln
+1.961 bln
4.87%
jan 1, 1982
41.462 bln
-748.03 mln
-1.77%
jan 1, 1983
44.385 bln
+2.924 bln
7.05%
jan 1, 1984
44.514 bln
+128.207 mln
0.29%
jan 1, 1985
47.441 bln
+2.928 bln
6.58%
jan 1, 1986
51.602 bln
+4.161 bln
8.77%
jan 1, 1987
54.182 bln
+2.579 bln
5.0%
jan 1, 1988
53.981 bln
-200.498 mln
-0.37%
jan 1, 1989
55.946 bln
+1.965 bln
3.64%
jan 1, 1990
59.129 bln
+3.182 bln
5.69%
jan 1, 1991
62.087 bln
+2.959 bln
5.0%
jan 1, 1992
65.641 bln
+3.554 bln
5.72%
jan 1, 1993
66.939 bln
+1.298 bln
1.98%
jan 1, 1994
66.615 bln
-323.498 mln
-0.48%
jan 1, 1995
70.889 bln
+4.274 bln
6.42%
jan 1, 1996
70.242 bln
-647.154 mln
-0.91%
jan 1, 1997
78.501 bln
+8.259 bln
11.76%
jan 1, 1998
75.658 bln
-2.844 bln
-3.62%
jan 1, 1999
82.826 bln
+7.168 bln
9.47%
jan 1, 2000
81.796 bln
-1.03 bln
-1.24%
jan 1, 2001
81.14 bln
-656.082 mln
-0.8%
jan 1, 2002
83.722 bln
+2.582 bln
3.18%
jan 1, 2003
89.931 bln
+6.209 bln
7.42%
jan 1, 2004
93.618 bln
+3.687 bln
4.1%
jan 1, 2005
97.311 bln
+3.693 bln
3.94%
jan 1, 2006
103.259 bln
+5.948 bln
6.11%
jan 1, 2007
110.042 bln
+6.784 bln
6.57%
jan 1, 2008
107.242 bln
-2.801 bln
-2.55%
jan 1, 2009
98.911 bln
-8.331 bln
-7.77%
jan 1, 2010
108.912 bln
+10.001 bln
10.11%
jan 1, 2011
113.325 bln
+4.413 bln
4.05%
jan 1, 2012
118.79 bln
+5.466 bln
4.82%
jan 1, 2013
120.814 bln
+2.024 bln
1.7%
jan 1, 2014
128.59 bln
+7.776 bln
6.44%
jan 1, 2015
131.402 bln
+2.812 bln
2.19%
Ranking of countries by current statistics by years


Comments: