29
/
en
AIzaSyAYiBZKx7MnpbEhh9jyipgxe19OcubqV5w
April 1, 2024
156970
Iran, Islamic Rep.
IRN
true
2
1
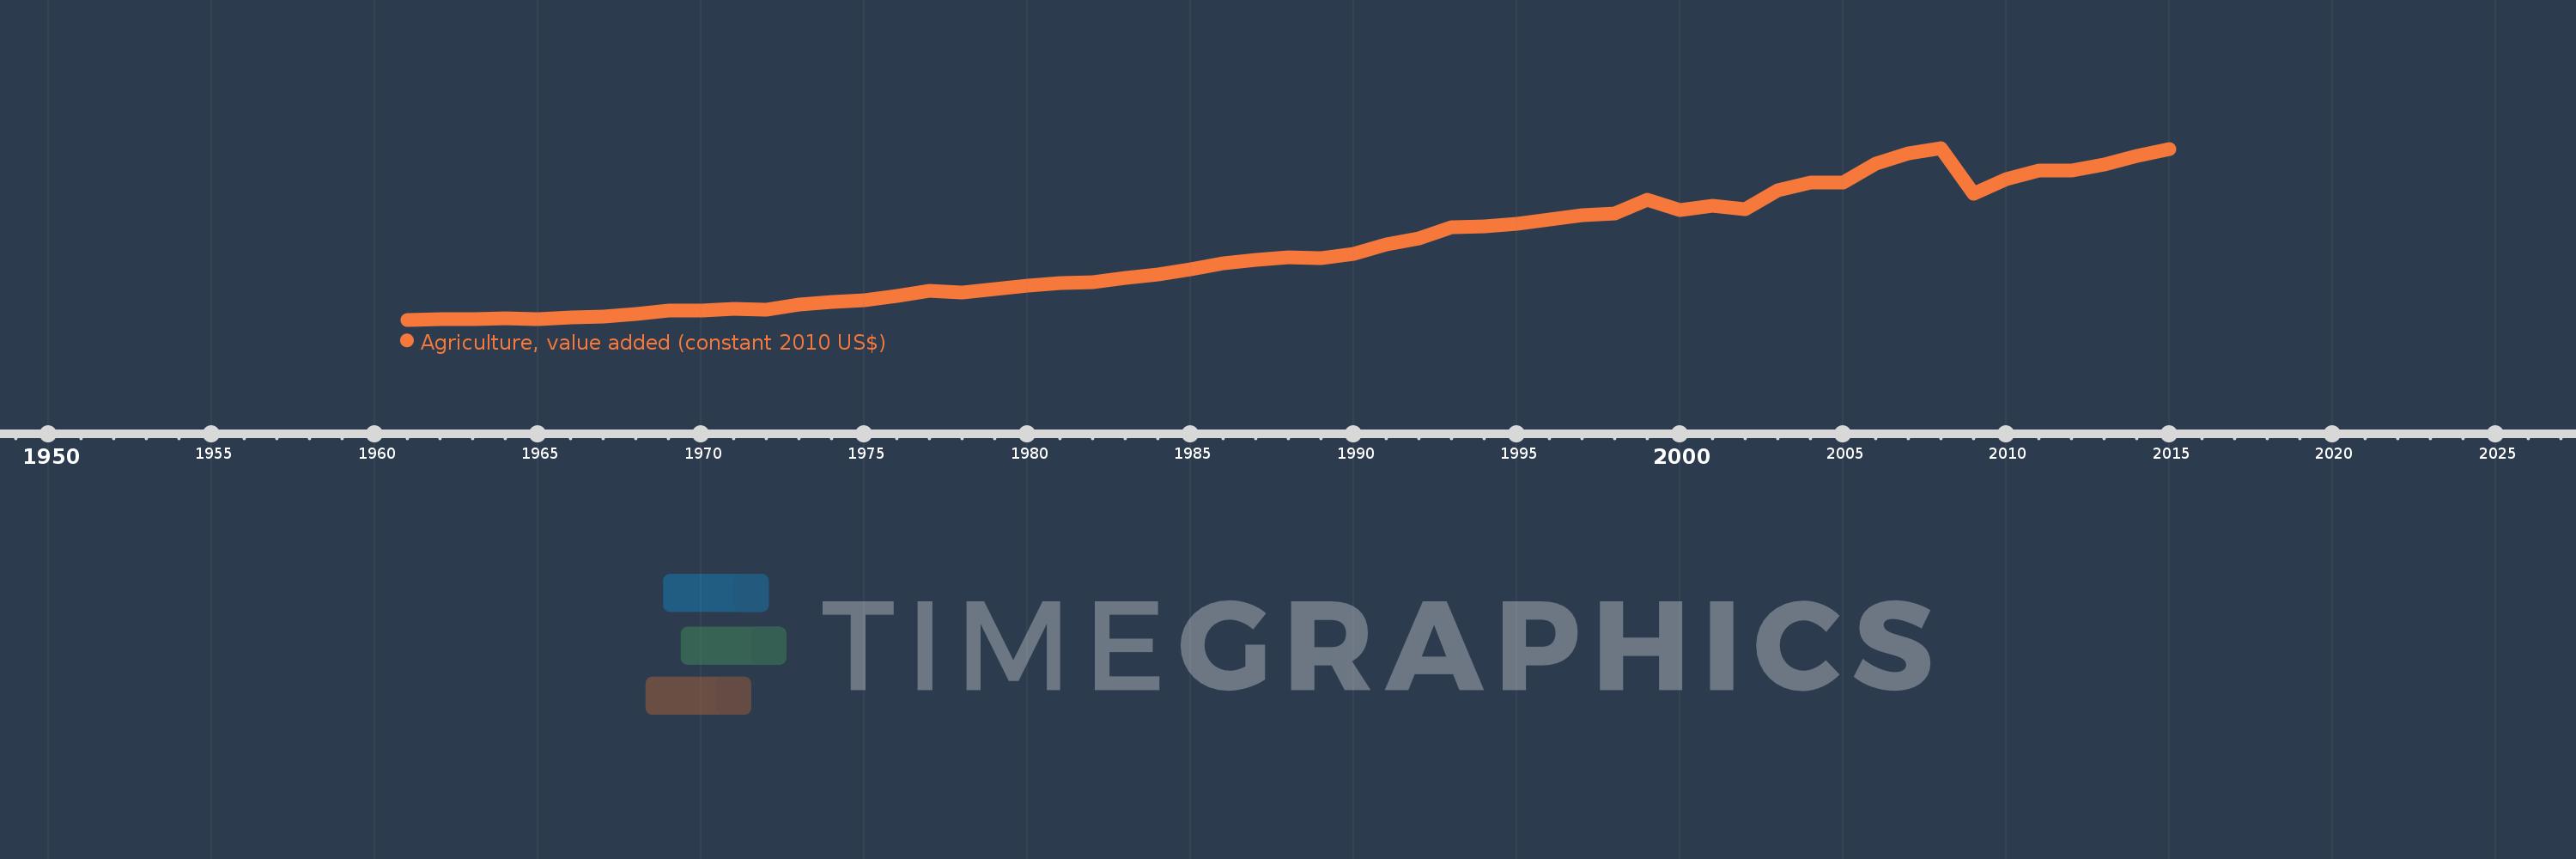
Agriculture, value added (constant 2010 US$)
2015,2014,2013,2012,2011,2010,2009,2008,2007,2006,2005,2004,2003,2002,2001,2000,1999,1998,1997,1996,1995,1994,1993,1992,1991,1990,1989,1988,1987,1986,1985,1984,1983,1982,1981,1980,1979,1978,1977,1976,1975,1974,1973,1972,1971,1970,1969,1968,1967,1966,1965,1964,1963,1962,1961
This statistics in other country:
AfghanistanAlbaniaAlgeriaAndorraAntigua and BarbudaArab WorldArgentinaArmeniaArubaAustraliaAustriaAzerbaijanBahamas, TheBahrainBangladeshBarbadosBelarusBelgiumBelizeBeninBermudaBhutanBoliviaBosnia and HerzegovinaBotswanaBrazilBrunei DarussalamBulgariaBurkina FasoBurundiCabo VerdeCambodiaCameroonCanadaCaribbean small statesCentral African RepublicCentral Europe and the BalticsChadChileChinaColombiaComorosCongo, Dem. Rep.Congo, Rep.Costa RicaCote d'IvoireCroatiaCubaCyprusCzech RepublicDenmarkDominicaDominican RepublicEarly-demographic dividendEast Asia & PacificEast Asia & Pacific (excluding high income)East Asia & Pacific (IDA & IBRD countries)EcuadorEgypt, Arab Rep.El SalvadorEquatorial GuineaEstoniaEthiopiaEuro areaEurope & Central AsiaEurope & Central Asia (excluding high income)Europe & Central Asia (IDA & IBRD countries)European UnionFijiFinlandFragile and conflict affected situationsFranceGabonGambia, TheGeorgiaGermanyGhanaGreeceGrenadaGuatemalaGuineaGuinea-BissauGuyanaHeavily indebted poor countries (HIPC)High incomeHondurasHong Kong SAR, ChinaHungaryIBRD onlyIcelandIDA & IBRD totalIDA blendIDA onlyIDA totalIndiaIndonesiaIran, Islamic Rep.IraqIrelandItalyJamaicaJapanJordanKazakhstanKenyaKiribatiKorea, Rep.KosovoKuwaitKyrgyz RepublicLao PDRLate-demographic dividendLatin America & Caribbean Latin America & Caribbean (excluding high income)Latin America & the Caribbean (IDA & IBRD countries)LatviaLeast developed countries: UN classificationLebanonLesothoLiberiaLithuaniaLow & middle incomeLow incomeLower middle incomeLuxembourgMacao SAR, ChinaMacedonia, FYRMadagascarMalawiMalaysiaMaldivesMaliMaltaMarshall IslandsMauritaniaMauritiusMexicoMicronesia, Fed. Sts.Middle East & North AfricaMiddle East & North Africa (excluding high income)Middle East & North Africa (IDA & IBRD countries)Middle incomeMoldovaMongoliaMontenegroMoroccoMozambiqueMyanmarNamibiaNepalNetherlandsNew ZealandNicaraguaNigerNigeriaNorth AmericaNorwayOECD membersOmanOther small statesPakistanPalauPanamaParaguayPeruPhilippinesPolandPortugalPost-demographic dividendPre-demographic dividendPuerto RicoQatarRomaniaRussian FederationRwandaSamoaSao Tome and PrincipeSaudi ArabiaSenegalSerbiaSeychellesSierra LeoneSingaporeSlovak RepublicSloveniaSmall statesSouth AfricaSouth AsiaSouth Asia (IDA & IBRD)SpainSri LankaSt. Kitts and NevisSt. LuciaSt. Vincent and the GrenadinesSub-Saharan Africa Sub-Saharan Africa (excluding high income)Sub-Saharan Africa (IDA & IBRD countries)SudanSurinameSwazilandSwedenSwitzerlandTajikistanTanzaniaThailandTimor-LesteTogoTongaTrinidad and TobagoTunisiaTurkeyTurkmenistanTuvaluUgandaUkraineUnited Arab EmiratesUnited KingdomUnited StatesUpper middle incomeUruguayUzbekistanVanuatuVenezuela, RBVietnamWest Bank and GazaWorldYemen, Rep.ZambiaZimbabwe Timeline:
This timeline shows a graph from 1961 to 2015 of Iran, Islamic Rep.. No data until 1960. Number of actual observations by date: 55.
Source name:
World Development Indicators
Source organization:
World Bank national accounts data, and OECD National Accounts data files.
Categories, topics:
Economy & Growth
Last updated:
apr 23, 2017
Indicators value changes by year
Minimum:
4.68 bln
jan 1, 1961
Maximum:
35.818 bln
jan 1, 2008
At the date of observation
Value
Absolute change
Change from previous value
jan 1, 1961
4.68 bln
+4.68 bln
0.0%
jan 1, 1962
4.744 bln
+63.635 mln
1.36%
jan 1, 1963
4.768 bln
+23.496 mln
0.5%
jan 1, 1964
4.882 bln
+114.828 mln
2.41%
jan 1, 1965
4.783 bln
-99.727 mln
-2.04%
jan 1, 1966
5.148 bln
+365.696 mln
7.65%
jan 1, 1967
5.333 bln
+184.596 mln
3.59%
jan 1, 1968
5.758 bln
+424.741 mln
7.96%
jan 1, 1969
6.306 bln
+548.148 mln
9.52%
jan 1, 1970
6.385 bln
+78.845 mln
1.25%
jan 1, 1971
6.598 bln
+213.384 mln
3.34%
jan 1, 1972
6.556 bln
-41.945 mln
-0.64%
jan 1, 1973
7.443 bln
+886.89 mln
13.53%
jan 1, 1974
7.875 bln
+431.593 mln
5.8%
jan 1, 1975
8.145 bln
+270.512 mln
3.44%
jan 1, 1976
8.947 bln
+801.434 mln
9.84%
jan 1, 1977
9.995 bln
+1.049 bln
11.72%
jan 1, 1978
9.604 bln
-391.075 mln
-3.91%
jan 1, 1979
10.247 bln
+642.339 mln
6.69%
jan 1, 1980
10.868 bln
+621.738 mln
6.07%
jan 1, 1981
11.269 bln
+400.609 mln
3.69%
jan 1, 1982
11.478 bln
+208.651 mln
1.85%
jan 1, 1983
12.295 bln
+817.308 mln
7.12%
jan 1, 1984
12.855 bln
+559.831 mln
4.55%
jan 1, 1985
13.798 bln
+943.599 mln
7.34%
jan 1, 1986
14.888 bln
+1.09 bln
7.9%
jan 1, 1987
15.596 bln
+707.838 mln
4.75%
jan 1, 1988
15.983 bln
+387.302 mln
2.48%
jan 1, 1989
15.881 bln
-102.634 mln
-0.64%
jan 1, 1990
16.569 bln
+688.661 mln
4.34%
jan 1, 1991
18.397 bln
+1.827 bln
11.03%
jan 1, 1992
19.43 bln
+1.034 bln
5.62%
jan 1, 1993
21.429 bln
+1.999 bln
10.29%
jan 1, 1994
21.635 bln
+206.527 mln
0.96%
jan 1, 1995
22.092 bln
+456.794 mln
2.11%
jan 1, 1996
22.911 bln
+819.222 mln
3.71%
jan 1, 1997
23.665 bln
+753.166 mln
3.29%
jan 1, 1998
23.897 bln
+232.844 mln
0.98%
jan 1, 1999
26.422 bln
+2.525 bln
10.57%
jan 1, 2000
24.493 bln
-1.929 bln
-7.3%
jan 1, 2001
25.344 bln
+850.79 mln
3.47%
jan 1, 2002
24.77 bln
-573.529 mln
-2.26%
jan 1, 2003
28.129 bln
+3.359 bln
13.56%
jan 1, 2004
29.521 bln
+1.393 bln
4.95%
jan 1, 2005
29.614 bln
+93.106 mln
0.32%
jan 1, 2006
32.954 bln
+3.34 bln
11.28%
jan 1, 2007
34.812 bln
+1.858 bln
5.64%
jan 1, 2008
35.818 bln
+1.006 bln
2.89%
jan 1, 2009
27.571 bln
-8.247 bln
-23.02%
jan 1, 2010
30.218 bln
+2.647 bln
9.6%
jan 1, 2011
31.707 bln
+1.488 bln
4.93%
jan 1, 2012
31.677 bln
-29.315 mln
-0.09%
jan 1, 2013
32.849 bln
+1.172 bln
3.7%
jan 1, 2014
34.38 bln
+1.531 bln
4.66%
jan 1, 2015
35.682 bln
+1.302 bln
3.79%
Ranking of countries by current statistics by years


Comments: