29
/
en
AIzaSyAYiBZKx7MnpbEhh9jyipgxe19OcubqV5w
April 1, 2024
29657
Euro area
EMU
false
2
1
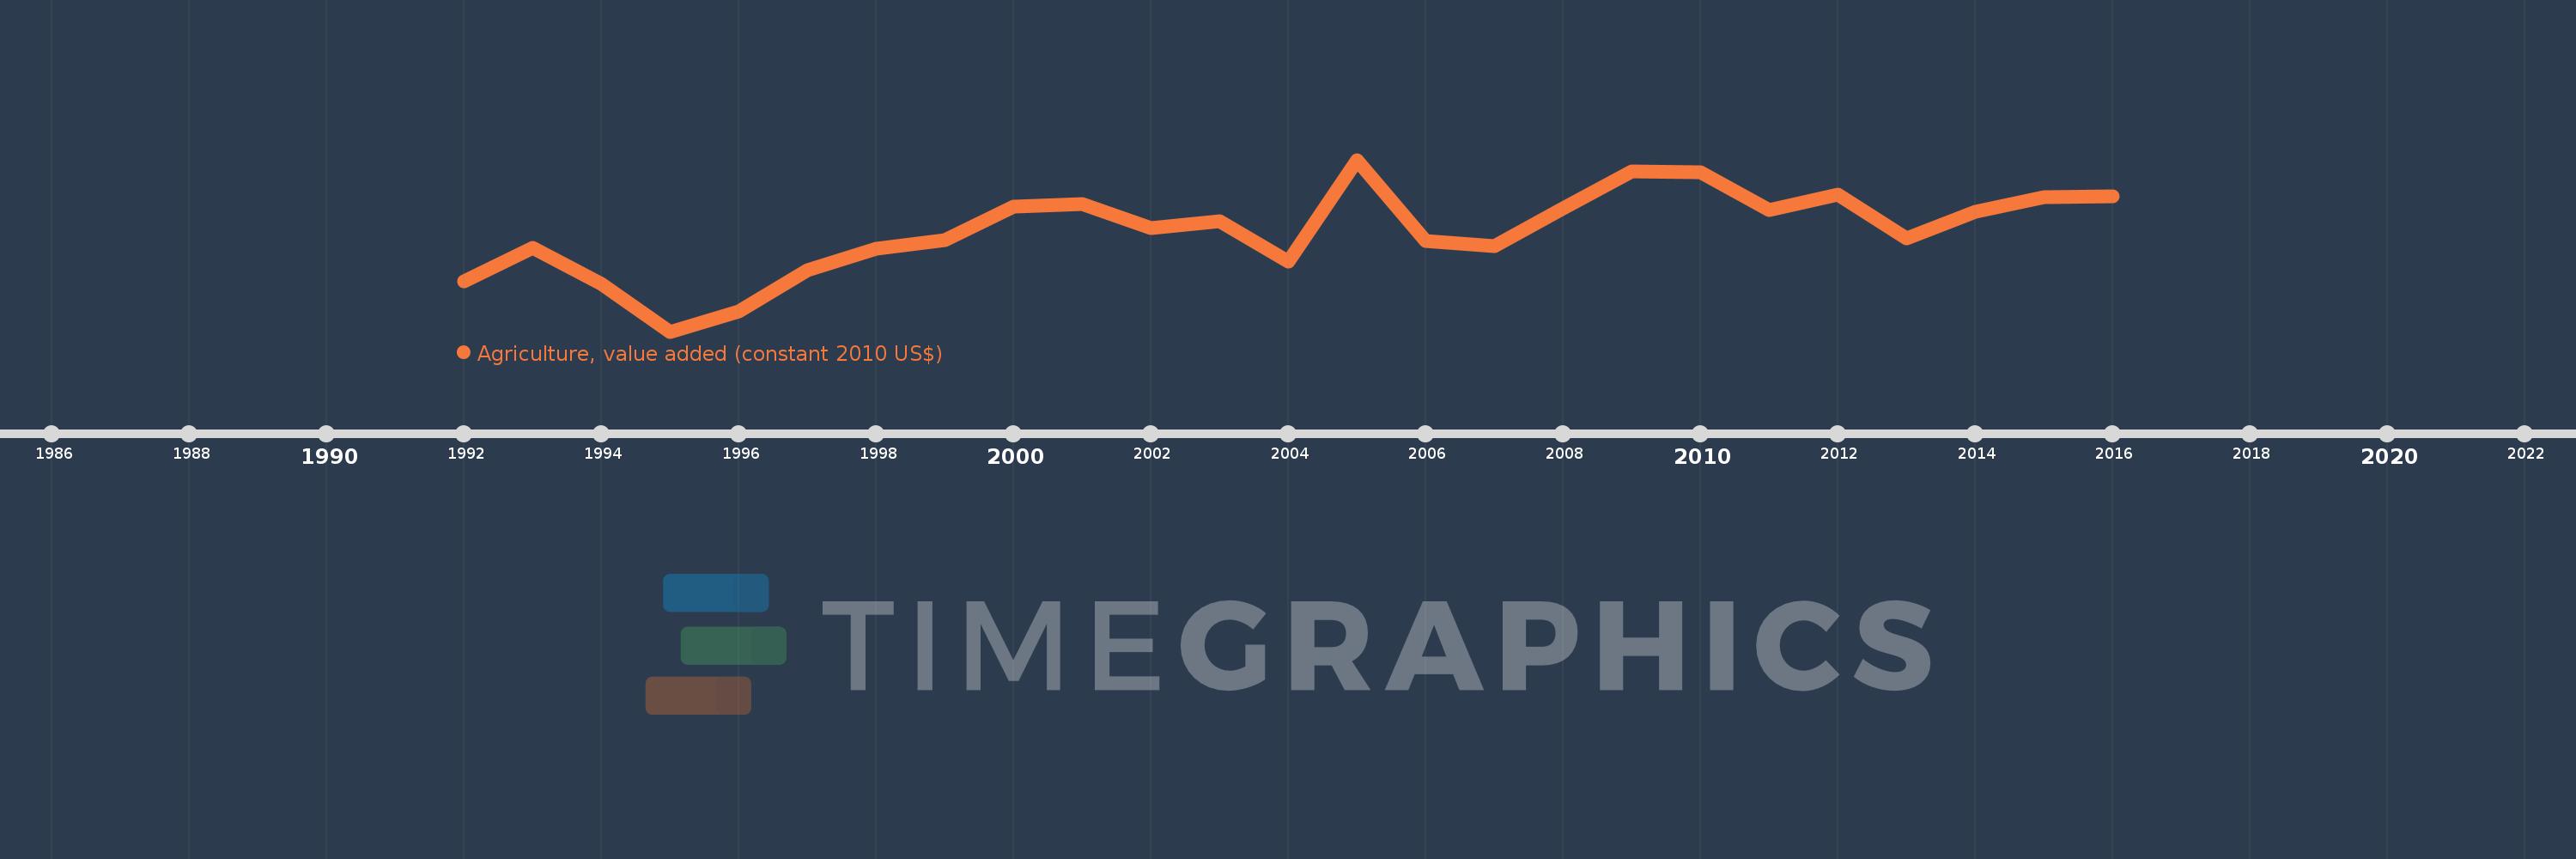
Agriculture, value added (constant 2010 US$)
2016,2015,2014,2013,2012,2011,2010,2009,2008,2007,2006,2005,2004,2003,2002,2001,2000,1999,1998,1997,1996,1995,1994,1993,1992
This statistics in other country:
AfghanistanAlbaniaAlgeriaAndorraAntigua and BarbudaArab WorldArgentinaArmeniaArubaAustraliaAustriaAzerbaijanBahamas, TheBahrainBangladeshBarbadosBelarusBelgiumBelizeBeninBermudaBhutanBoliviaBosnia and HerzegovinaBotswanaBrazilBrunei DarussalamBulgariaBurkina FasoBurundiCabo VerdeCambodiaCameroonCanadaCaribbean small statesCentral African RepublicCentral Europe and the BalticsChadChileChinaColombiaComorosCongo, Dem. Rep.Congo, Rep.Costa RicaCote d'IvoireCroatiaCubaCyprusCzech RepublicDenmarkDominicaDominican RepublicEarly-demographic dividendEast Asia & PacificEast Asia & Pacific (excluding high income)East Asia & Pacific (IDA & IBRD countries)EcuadorEgypt, Arab Rep.El SalvadorEquatorial GuineaEstoniaEthiopiaEuro areaEurope & Central AsiaEurope & Central Asia (excluding high income)Europe & Central Asia (IDA & IBRD countries)European UnionFijiFinlandFragile and conflict affected situationsFranceGabonGambia, TheGeorgiaGermanyGhanaGreeceGrenadaGuatemalaGuineaGuinea-BissauGuyanaHeavily indebted poor countries (HIPC)High incomeHondurasHong Kong SAR, ChinaHungaryIBRD onlyIcelandIDA & IBRD totalIDA blendIDA onlyIDA totalIndiaIndonesiaIran, Islamic Rep.IraqIrelandItalyJamaicaJapanJordanKazakhstanKenyaKiribatiKorea, Rep.KosovoKuwaitKyrgyz RepublicLao PDRLate-demographic dividendLatin America & Caribbean Latin America & Caribbean (excluding high income)Latin America & the Caribbean (IDA & IBRD countries)LatviaLeast developed countries: UN classificationLebanonLesothoLiberiaLithuaniaLow & middle incomeLow incomeLower middle incomeLuxembourgMacao SAR, ChinaMacedonia, FYRMadagascarMalawiMalaysiaMaldivesMaliMaltaMarshall IslandsMauritaniaMauritiusMexicoMicronesia, Fed. Sts.Middle East & North AfricaMiddle East & North Africa (excluding high income)Middle East & North Africa (IDA & IBRD countries)Middle incomeMoldovaMongoliaMontenegroMoroccoMozambiqueMyanmarNamibiaNepalNetherlandsNew ZealandNicaraguaNigerNigeriaNorth AmericaNorwayOECD membersOmanOther small statesPakistanPalauPanamaParaguayPeruPhilippinesPolandPortugalPost-demographic dividendPre-demographic dividendPuerto RicoQatarRomaniaRussian FederationRwandaSamoaSao Tome and PrincipeSaudi ArabiaSenegalSerbiaSeychellesSierra LeoneSingaporeSlovak RepublicSloveniaSmall statesSouth AfricaSouth AsiaSouth Asia (IDA & IBRD)SpainSri LankaSt. Kitts and NevisSt. LuciaSt. Vincent and the GrenadinesSub-Saharan Africa Sub-Saharan Africa (excluding high income)Sub-Saharan Africa (IDA & IBRD countries)SudanSurinameSwazilandSwedenSwitzerlandTajikistanTanzaniaThailandTimor-LesteTogoTongaTrinidad and TobagoTunisiaTurkeyTurkmenistanTuvaluUgandaUkraineUnited Arab EmiratesUnited KingdomUnited StatesUpper middle incomeUruguayUzbekistanVanuatuVenezuela, RBVietnamWest Bank and GazaWorldYemen, Rep.ZambiaZimbabwe Timeline:
This timeline shows a graph from 1992 to 2016 of Euro area. No data until 1991. Number of actual observations by date: 25.
Source name:
World Development Indicators
Source organization:
World Bank national accounts data, and OECD National Accounts data files.
Categories, topics:
Economy & Growth
Last updated:
apr 23, 2017
Indicators value changes by year
Minimum:
162.139 bln
jan 1, 1995
Maximum:
196.62 bln
jan 1, 2005
At the date of observation
Value
Absolute change
Change from previous value
jan 1, 1992
172.283 bln
+172.283 bln
0.0%
jan 1, 1993
178.88 bln
+6.597 bln
3.83%
jan 1, 1994
171.784 bln
-7.096 bln
-3.97%
jan 1, 1995
162.139 bln
-9.645 bln
-5.61%
jan 1, 1996
166.245 bln
+4.106 bln
2.53%
jan 1, 1997
174.507 bln
+8.262 bln
4.97%
jan 1, 1998
178.714 bln
+4.207 bln
2.41%
jan 1, 1999
180.51 bln
+1.796 bln
1.0%
jan 1, 2000
187.251 bln
+6.741 bln
3.73%
jan 1, 2001
187.761 bln
+509.572 mln
0.27%
jan 1, 2002
182.951 bln
-4.809 bln
-2.56%
jan 1, 2003
184.304 bln
+1.353 bln
0.74%
jan 1, 2004
176.239 bln
-8.065 bln
-4.38%
jan 1, 2005
196.62 bln
+20.381 bln
11.56%
jan 1, 2006
180.292 bln
-16.329 bln
-8.3%
jan 1, 2007
179.367 bln
-925.005 mln
-0.51%
jan 1, 2008
186.909 bln
+7.542 bln
4.2%
jan 1, 2009
194.273 bln
+7.365 bln
3.94%
jan 1, 2010
194.205 bln
-67.925 mln
-0.03%
jan 1, 2011
186.482 bln
-7.723 bln
-3.98%
jan 1, 2012
189.577 bln
+3.095 bln
1.66%
jan 1, 2013
180.81 bln
-8.767 bln
-4.62%
jan 1, 2014
186.199 bln
+5.389 bln
2.98%
jan 1, 2015
189.167 bln
+2.968 bln
1.59%
jan 1, 2016
189.318 bln
+151.296 mln
0.08%
Ranking of countries by current statistics by years


Comments: