29
/
en
AIzaSyAYiBZKx7MnpbEhh9jyipgxe19OcubqV5w
April 1, 2024
89447
Botswana
BWA
true
2
1
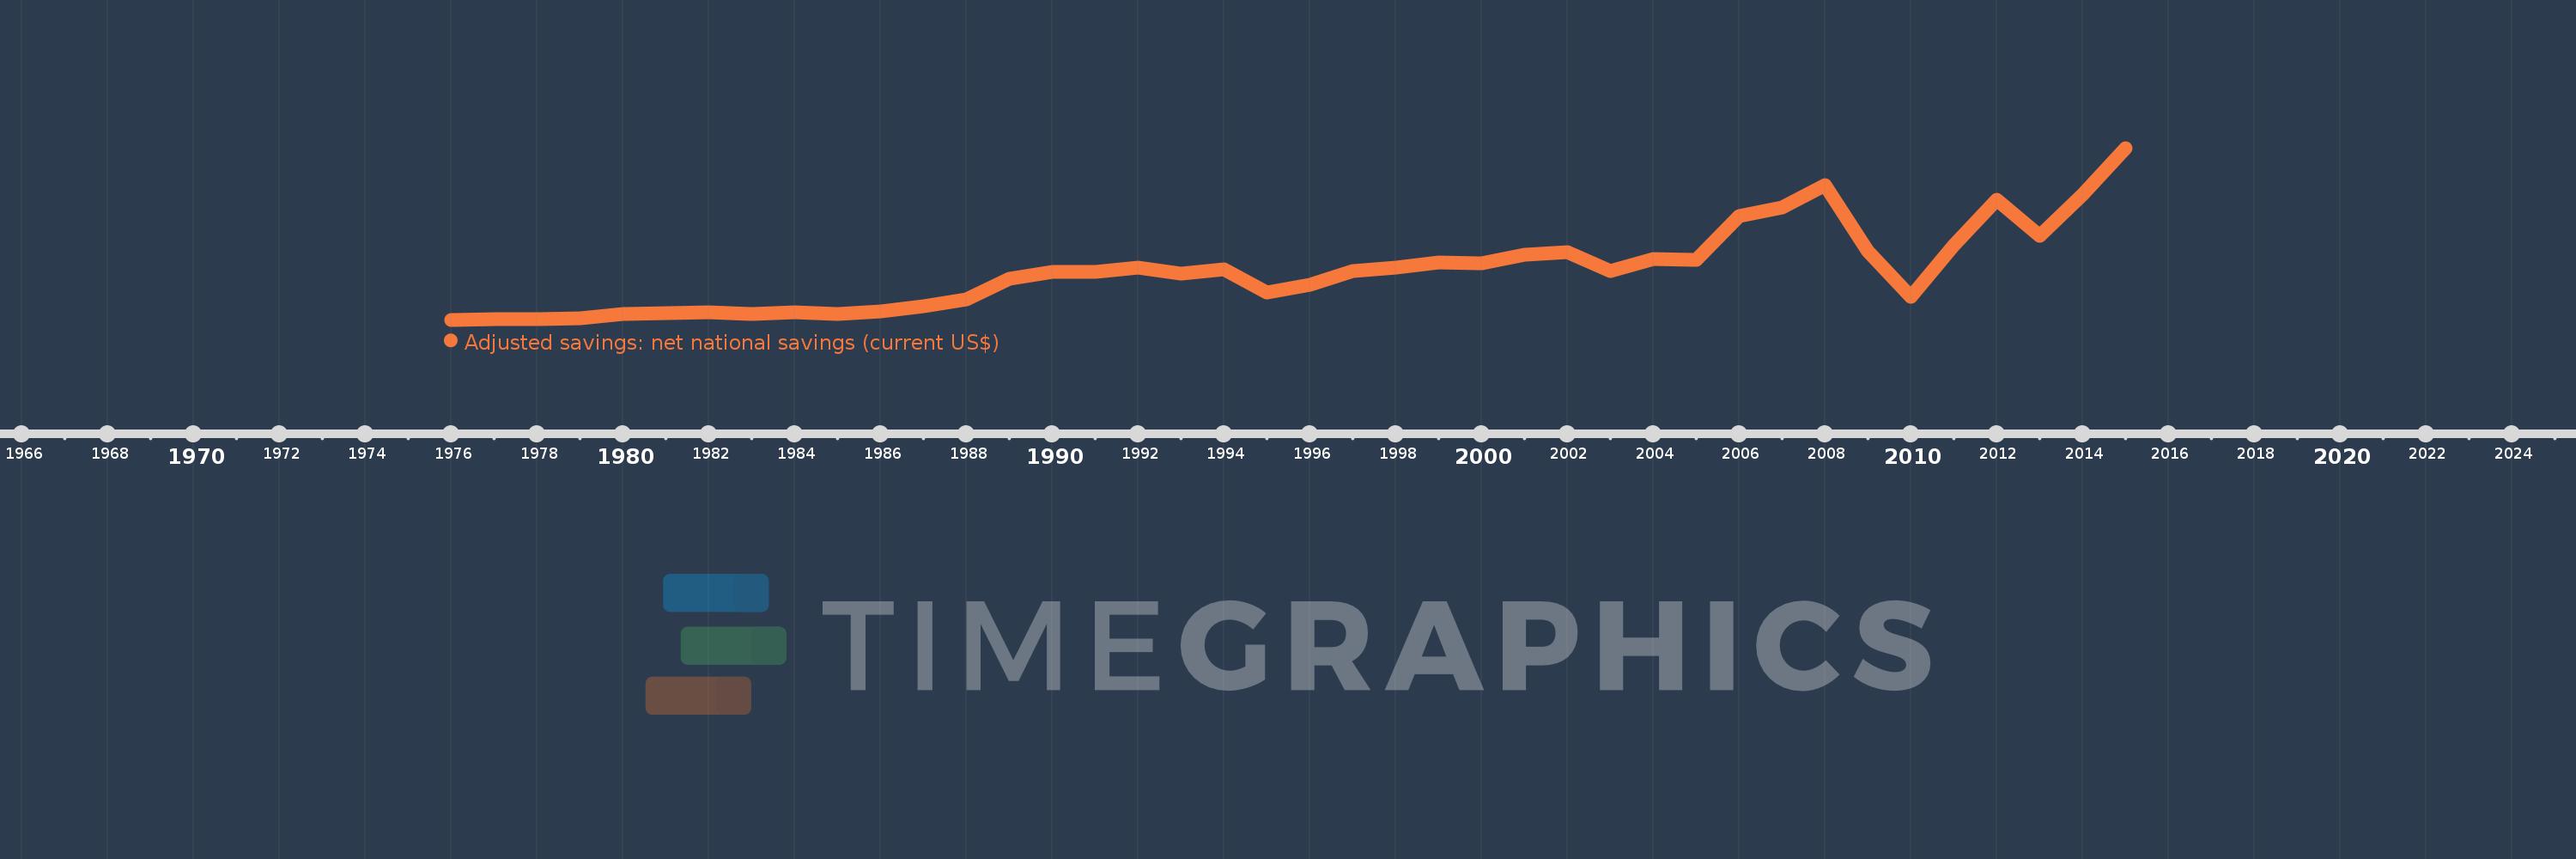
Adjusted savings: net national savings (current US$)
2015,2014,2013,2012,2011,2010,2009,2008,2007,2006,2005,2004,2003,2002,2001,2000,1999,1998,1997,1996,1995,1994,1993,1992,1991,1990,1989,1988,1987,1986,1985,1984,1983,1982,1981,1980,1979,1978,1977,1976
This statistics in other country:
AfghanistanAlbaniaAlgeriaAngolaAntigua and BarbudaArgentinaArmeniaAustraliaAustriaAzerbaijanBahamas, TheBahrainBangladeshBarbadosBelarusBelgiumBelizeBeninBermudaBhutanBoliviaBosnia and HerzegovinaBotswanaBrazilBrunei DarussalamBulgariaBurkina FasoBurundiCabo VerdeCambodiaCameroonCanadaCentral African RepublicChadChileChinaColombiaComorosCongo, Dem. Rep.Congo, Rep.Costa RicaCote d'IvoireCroatiaCyprusCzech RepublicDenmarkDjiboutiDominicaDominican RepublicEcuadorEgypt, Arab Rep.El SalvadorEquatorial GuineaEritreaEstoniaEthiopiaFijiFinlandFranceGabonGambia, TheGeorgiaGermanyGhanaGreeceGrenadaGuatemalaGuineaGuinea-BissauGuyanaHaitiHondurasHong Kong SAR, ChinaHungaryIcelandIndiaIndonesiaIran, Islamic Rep.IraqIrelandIsraelItalyJamaicaJapanJordanKazakhstanKenyaKiribatiKorea, Rep.KosovoKuwaitKyrgyz RepublicLao PDRLatviaLebanonLesothoLiberiaLibyaLithuaniaLuxembourgMacao SAR, ChinaMacedonia, FYRMadagascarMalawiMalaysiaMaldivesMaliMaltaMauritaniaMauritiusMexicoMoldovaMongoliaMontenegroMoroccoMozambiqueNamibiaNepalNetherlandsNew ZealandNicaraguaNigerNigeriaNorwayOmanPakistanPanamaPapua New GuineaParaguayPeruPhilippinesPolandPortugalQatarRomaniaRussian FederationRwandaSaudi ArabiaSenegalSerbiaSeychellesSierra LeoneSingaporeSlovak RepublicSloveniaSolomon IslandsSouth AfricaSpainSri LankaSt. Kitts and NevisSt. LuciaSt. Vincent and the GrenadinesSudanSurinameSwazilandSwedenSwitzerlandSyrian Arab RepublicTajikistanTanzaniaThailandTimor-LesteTogoTongaTrinidad and TobagoTunisiaTurkeyTurkmenistanUgandaUkraineUnited KingdomUnited StatesUruguayVanuatuVenezuela, RBVietnamWest Bank and GazaYemen, Rep.ZambiaZimbabwe Timeline:
This timeline shows a graph from 1976 to 2015 of Botswana. No data until 1975. Number of actual observations by date: 40.
Source name:
World Development Indicators
Source organization:
World Bank staff estimates based on sources and methods in World Bank's "The Changing Wealth of Nations: Measuring Sustainable Development in the New Millennium" (2011).
Categories, topics:
Economy & Growth, Environment
Last updated:
apr 23, 2017
Indicators value changes by year
Minimum:
20.955 mln
jan 1, 1976
Maximum:
4.256 bln
jan 1, 2015
At the date of observation
Value
Absolute change
Change from previous value
jan 1, 1976
20.955 mln
+20.955 mln
0.0%
jan 1, 1977
27.593 mln
+6.637 mln
31.67%
jan 1, 1978
39.16 mln
+11.567 mln
41.92%
jan 1, 1979
60.336 mln
+21.176 mln
54.08%
jan 1, 1980
152.492 mln
+92.156 mln
152.74%
jan 1, 1981
179.184 mln
+26.693 mln
17.5%
jan 1, 1982
197.414 mln
+18.23 mln
10.17%
jan 1, 1983
162.155 mln
-35.259 mln
-17.86%
jan 1, 1984
197.263 mln
+35.108 mln
21.65%
jan 1, 1985
168.32 mln
-28.942 mln
-14.67%
jan 1, 1986
235.26 mln
+66.94 mln
39.77%
jan 1, 1987
343.013 mln
+107.754 mln
45.8%
jan 1, 1988
526.981 mln
+183.968 mln
53.63%
jan 1, 1989
1.022 bln
+495.507 mln
94.03%
jan 1, 1990
1.198 bln
+175.142 mln
17.13%
jan 1, 1991
1.194 bln
-3.655 mln
-0.31%
jan 1, 1992
1.314 bln
+120.141 mln
10.06%
jan 1, 1993
1.169 bln
-145.508 mln
-11.07%
jan 1, 1994
1.256 bln
+86.984 mln
7.44%
jan 1, 1995
689.887 mln
-565.706 mln
-45.05%
jan 1, 1996
883.15 mln
+193.262 mln
28.01%
jan 1, 1997
1.212 bln
+328.806 mln
37.23%
jan 1, 1998
1.297 bln
+85.013 mln
7.01%
jan 1, 1999
1.443 bln
+146.47 mln
11.29%
jan 1, 2000
1.413 bln
-30.664 mln
-2.12%
jan 1, 2001
1.627 bln
+213.772 mln
15.13%
jan 1, 2002
1.695 bln
+68.111 mln
4.19%
jan 1, 2003
1.232 bln
-462.805 mln
-27.31%
jan 1, 2004
1.525 bln
+293.446 mln
23.82%
jan 1, 2005
1.5 bln
-24.866 mln
-1.63%
jan 1, 2006
2.58 bln
+1.079 bln
71.93%
jan 1, 2007
2.789 bln
+209.387 mln
8.12%
jan 1, 2008
3.347 bln
+557.772 mln
20.0%
jan 1, 2009
1.709 bln
-1.638 bln
-48.93%
jan 1, 2010
590.192 mln
-1.119 bln
-65.47%
jan 1, 2011
1.851 bln
+1.261 bln
213.71%
jan 1, 2012
2.983 bln
+1.131 bln
61.09%
jan 1, 2013
2.098 bln
-884.051 mln
-29.64%
jan 1, 2014
3.112 bln
+1.013 bln
48.29%
jan 1, 2015
4.256 bln
+1.145 bln
36.78%
Ranking of countries by current statistics by years


Comments: