29
/
en
AIzaSyAYiBZKx7MnpbEhh9jyipgxe19OcubqV5w
April 1, 2024
201193
Morocco
MAR
true
2
1
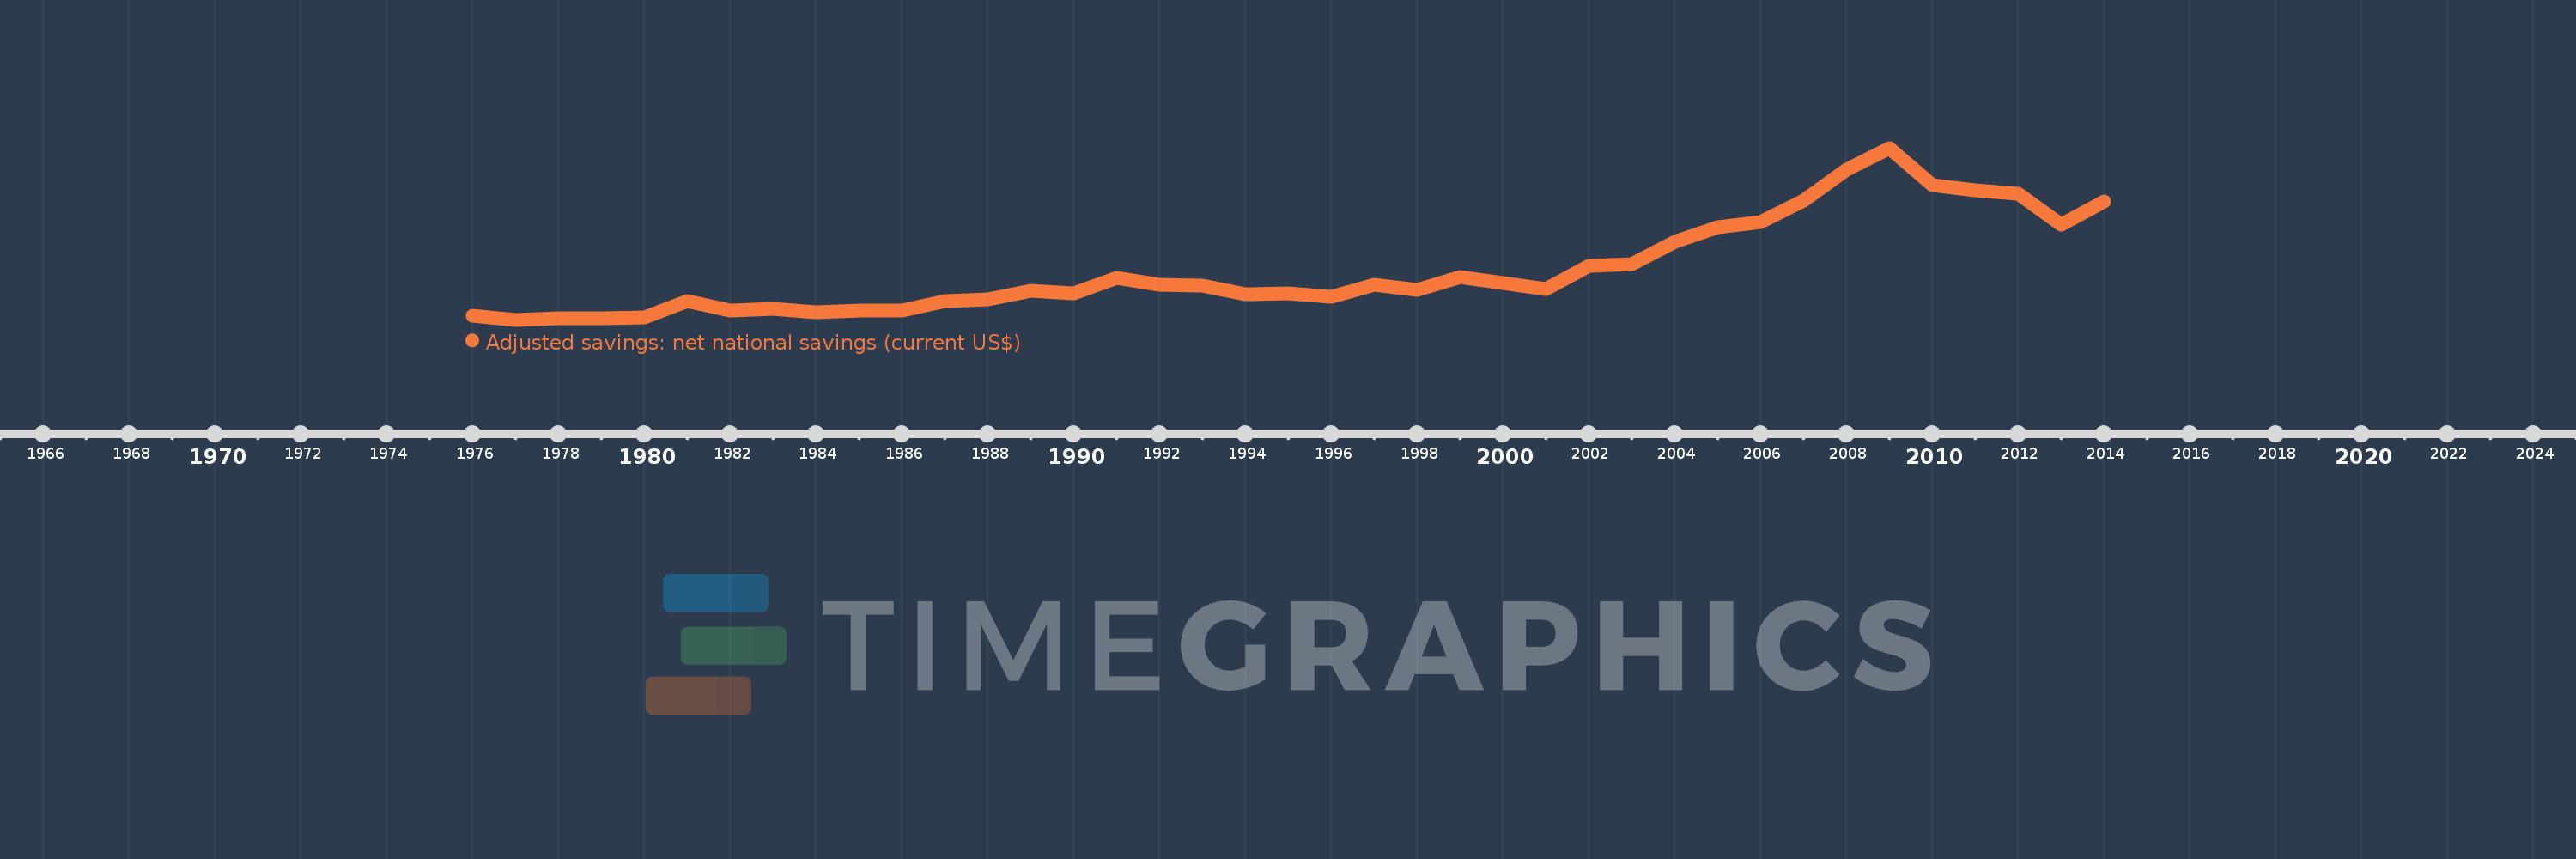
Adjusted savings: net national savings (current US$)
2014,2013,2012,2011,2010,2009,2008,2007,2006,2005,2004,2003,2002,2001,2000,1999,1998,1997,1996,1995,1994,1993,1992,1991,1990,1989,1988,1987,1986,1985,1984,1983,1982,1981,1980,1979,1978,1977,1976
This statistics in other country:
AfghanistanAlbaniaAlgeriaAngolaAntigua and BarbudaArgentinaArmeniaAustraliaAustriaAzerbaijanBahamas, TheBahrainBangladeshBarbadosBelarusBelgiumBelizeBeninBermudaBhutanBoliviaBosnia and HerzegovinaBotswanaBrazilBrunei DarussalamBulgariaBurkina FasoBurundiCabo VerdeCambodiaCameroonCanadaCentral African RepublicChadChileChinaColombiaComorosCongo, Dem. Rep.Congo, Rep.Costa RicaCote d'IvoireCroatiaCyprusCzech RepublicDenmarkDjiboutiDominicaDominican RepublicEcuadorEgypt, Arab Rep.El SalvadorEquatorial GuineaEritreaEstoniaEthiopiaFijiFinlandFranceGabonGambia, TheGeorgiaGermanyGhanaGreeceGrenadaGuatemalaGuineaGuinea-BissauGuyanaHaitiHondurasHong Kong SAR, ChinaHungaryIcelandIndiaIndonesiaIran, Islamic Rep.IraqIrelandIsraelItalyJamaicaJapanJordanKazakhstanKenyaKiribatiKorea, Rep.KosovoKuwaitKyrgyz RepublicLao PDRLatviaLebanonLesothoLiberiaLibyaLithuaniaLuxembourgMacao SAR, ChinaMacedonia, FYRMadagascarMalawiMalaysiaMaldivesMaliMaltaMauritaniaMauritiusMexicoMoldovaMongoliaMontenegroMoroccoMozambiqueNamibiaNepalNetherlandsNew ZealandNicaraguaNigerNigeriaNorwayOmanPakistanPanamaPapua New GuineaParaguayPeruPhilippinesPolandPortugalQatarRomaniaRussian FederationRwandaSaudi ArabiaSenegalSerbiaSeychellesSierra LeoneSingaporeSlovak RepublicSloveniaSolomon IslandsSouth AfricaSpainSri LankaSt. Kitts and NevisSt. LuciaSt. Vincent and the GrenadinesSudanSurinameSwazilandSwedenSwitzerlandSyrian Arab RepublicTajikistanTanzaniaThailandTimor-LesteTogoTongaTrinidad and TobagoTunisiaTurkeyTurkmenistanUgandaUkraineUnited KingdomUnited StatesUruguayVanuatuVenezuela, RBVietnamWest Bank and GazaYemen, Rep.ZambiaZimbabwe Timeline:
This timeline shows a graph from 1976 to 2014 of Morocco. No data until 1975. Number of actual observations by date: 39.
Source name:
World Development Indicators
Source organization:
World Bank staff estimates based on sources and methods in World Bank's "The Changing Wealth of Nations: Measuring Sustainable Development in the New Millennium" (2011).
Categories, topics:
Economy & Growth, Environment
Last updated:
apr 23, 2017
Indicators value changes by year
Minimum:
769.334 mln
jan 1, 1977
Maximum:
20.256 bln
jan 1, 2009
At the date of observation
Value
Absolute change
Change from previous value
jan 1, 1976
1.192 bln
+1.192 bln
0.0%
jan 1, 1977
769.334 mln
-422.449 mln
-35.45%
jan 1, 1978
963.993 mln
+194.659 mln
25.3%
jan 1, 1979
937.991 mln
-26.001 mln
-2.7%
jan 1, 1980
1.08 bln
+142.364 mln
15.18%
jan 1, 1981
2.861 bln
+1.781 bln
164.85%
jan 1, 1982
1.808 bln
-1.053 bln
-36.81%
jan 1, 1983
1.982 bln
+174.348 mln
9.64%
jan 1, 1984
1.657 bln
-325.545 mln
-16.42%
jan 1, 1985
1.781 bln
+124.524 mln
7.52%
jan 1, 1986
1.858 bln
+76.339 mln
4.29%
jan 1, 1987
2.927 bln
+1.069 bln
57.55%
jan 1, 1988
3.061 bln
+134.516 mln
4.6%
jan 1, 1989
4.055 bln
+993.821 mln
32.46%
jan 1, 1990
3.781 bln
-274.389 mln
-6.77%
jan 1, 1991
5.526 bln
+1.746 bln
46.17%
jan 1, 1992
4.759 bln
-767.099 mln
-13.88%
jan 1, 1993
4.629 bln
-130.314 mln
-2.74%
jan 1, 1994
3.689 bln
-940.017 mln
-20.31%
jan 1, 1995
3.808 bln
+119.312 mln
3.23%
jan 1, 1996
3.372 bln
-436.257 mln
-11.46%
jan 1, 1997
4.723 bln
+1.351 bln
40.08%
jan 1, 1998
4.195 bln
-528.249 mln
-11.18%
jan 1, 1999
5.637 bln
+1.442 bln
34.38%
jan 1, 2000
4.901 bln
-736.43 mln
-13.06%
jan 1, 2001
4.271 bln
-630.189 mln
-12.86%
jan 1, 2002
6.849 bln
+2.578 bln
60.36%
jan 1, 2003
7.096 bln
+247.368 mln
3.61%
jan 1, 2004
9.621 bln
+2.525 bln
35.58%
jan 1, 2005
11.303 bln
+1.683 bln
17.49%
jan 1, 2006
11.807 bln
+503.41 mln
4.45%
jan 1, 2007
14.247 bln
+2.44 bln
20.67%
jan 1, 2008
17.756 bln
+3.509 bln
24.63%
jan 1, 2009
20.256 bln
+2.501 bln
14.08%
jan 1, 2010
16.055 bln
-4.201 bln
-20.74%
jan 1, 2011
15.476 bln
-578.956 mln
-3.61%
jan 1, 2012
15.042 bln
-434.342 mln
-2.81%
jan 1, 2013
11.599 bln
-3.443 bln
-22.89%
jan 1, 2014
14.214 bln
+2.615 bln
22.54%
Ranking of countries by current statistics by years


Comments: