29
/
en
AIzaSyAYiBZKx7MnpbEhh9jyipgxe19OcubqV5w
April 1, 2024
156943
Iran, Islamic Rep.
IRN
true
2
1
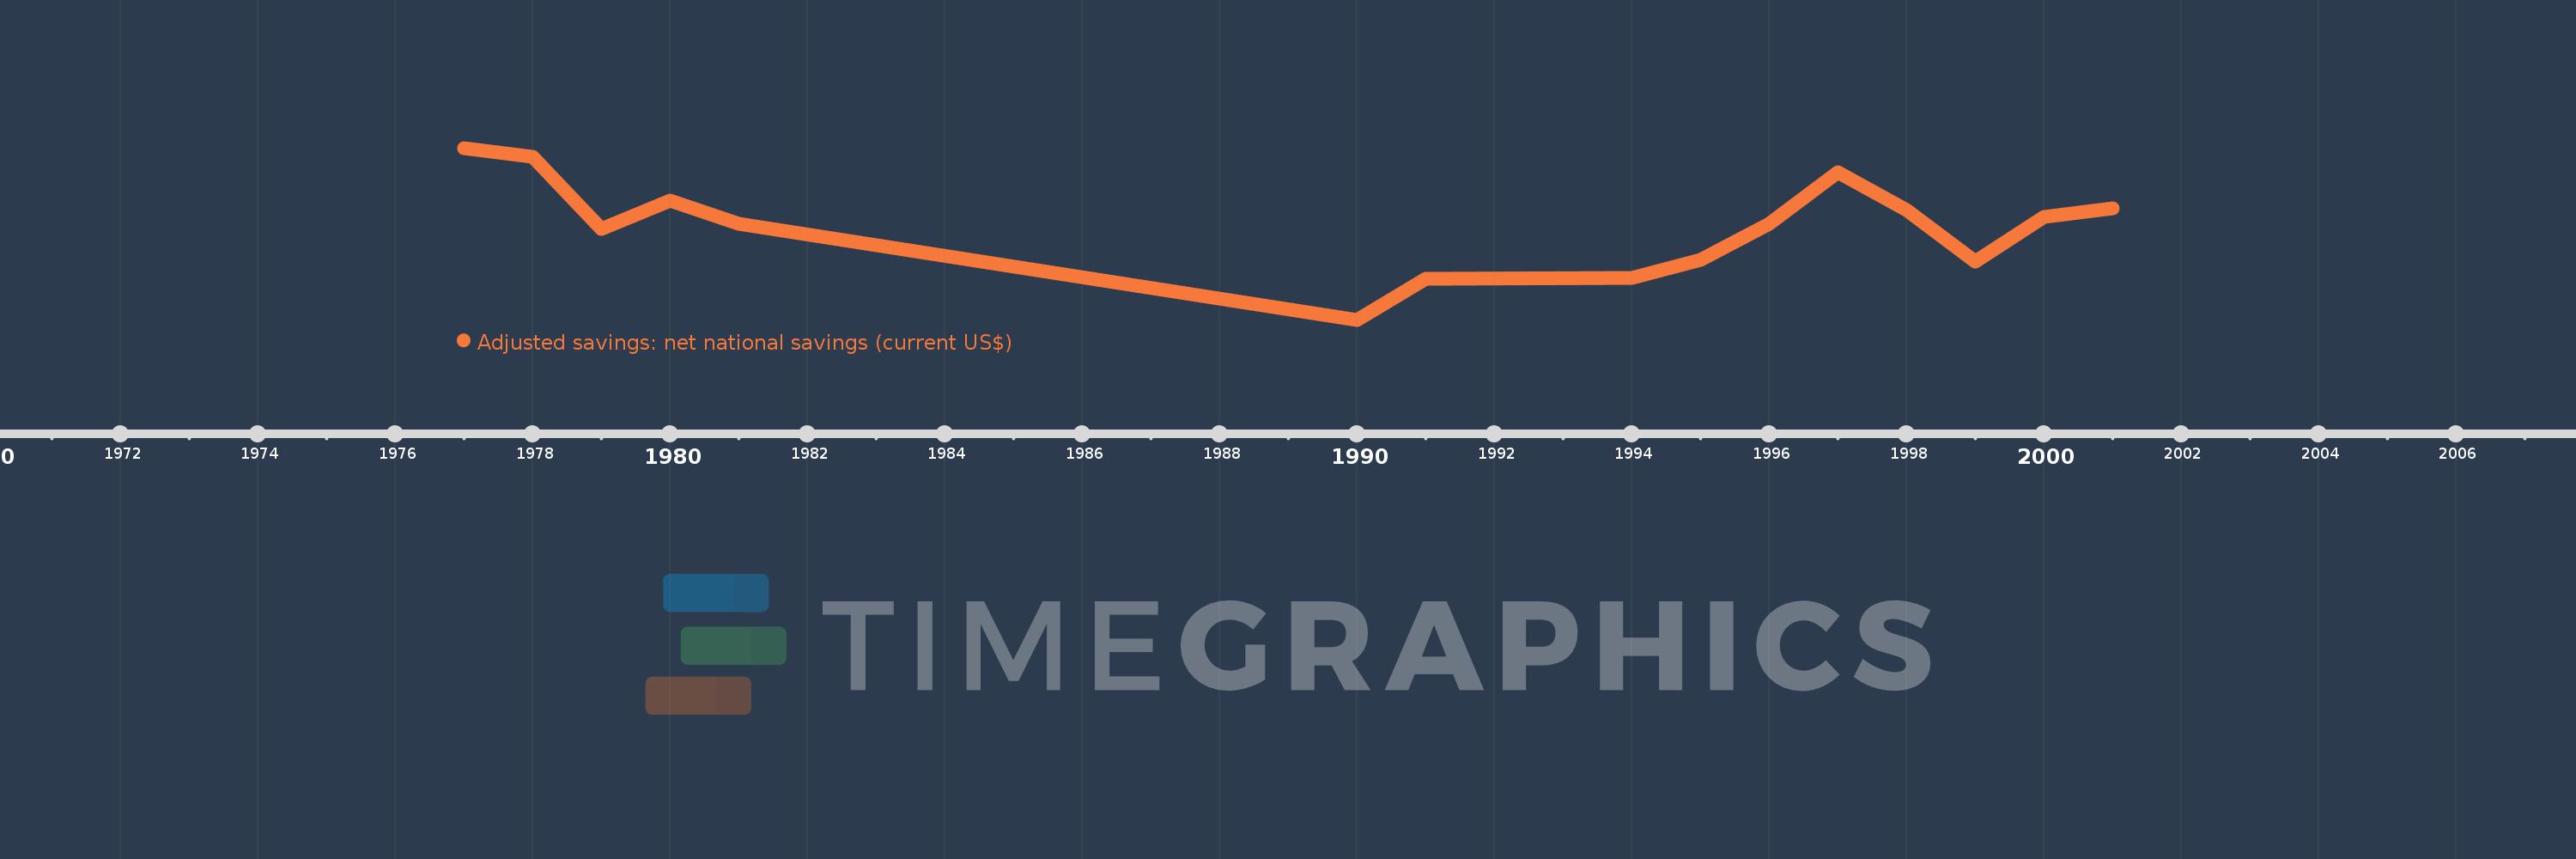
Adjusted savings: net national savings (current US$)
2001,2000,1999,1998,1997,1996,1995,1994,1991,1990,1981,1980,1979,1978,1977
This statistics in other country:
AfghanistanAlbaniaAlgeriaAngolaAntigua and BarbudaArgentinaArmeniaAustraliaAustriaAzerbaijanBahamas, TheBahrainBangladeshBarbadosBelarusBelgiumBelizeBeninBermudaBhutanBoliviaBosnia and HerzegovinaBotswanaBrazilBrunei DarussalamBulgariaBurkina FasoBurundiCabo VerdeCambodiaCameroonCanadaCentral African RepublicChadChileChinaColombiaComorosCongo, Dem. Rep.Congo, Rep.Costa RicaCote d'IvoireCroatiaCyprusCzech RepublicDenmarkDjiboutiDominicaDominican RepublicEcuadorEgypt, Arab Rep.El SalvadorEquatorial GuineaEritreaEstoniaEthiopiaFijiFinlandFranceGabonGambia, TheGeorgiaGermanyGhanaGreeceGrenadaGuatemalaGuineaGuinea-BissauGuyanaHaitiHondurasHong Kong SAR, ChinaHungaryIcelandIndiaIndonesiaIran, Islamic Rep.IraqIrelandIsraelItalyJamaicaJapanJordanKazakhstanKenyaKiribatiKorea, Rep.KosovoKuwaitKyrgyz RepublicLao PDRLatviaLebanonLesothoLiberiaLibyaLithuaniaLuxembourgMacao SAR, ChinaMacedonia, FYRMadagascarMalawiMalaysiaMaldivesMaliMaltaMauritaniaMauritiusMexicoMoldovaMongoliaMontenegroMoroccoMozambiqueNamibiaNepalNetherlandsNew ZealandNicaraguaNigerNigeriaNorwayOmanPakistanPanamaPapua New GuineaParaguayPeruPhilippinesPolandPortugalQatarRomaniaRussian FederationRwandaSaudi ArabiaSenegalSerbiaSeychellesSierra LeoneSingaporeSlovak RepublicSloveniaSolomon IslandsSouth AfricaSpainSri LankaSt. Kitts and NevisSt. LuciaSt. Vincent and the GrenadinesSudanSurinameSwazilandSwedenSwitzerlandSyrian Arab RepublicTajikistanTanzaniaThailandTimor-LesteTogoTongaTrinidad and TobagoTunisiaTurkeyTurkmenistanUgandaUkraineUnited KingdomUnited StatesUruguayVanuatuVenezuela, RBVietnamWest Bank and GazaYemen, Rep.ZambiaZimbabwe Timeline:
This timeline shows a graph from 1977 to 2001 of Iran, Islamic Rep.. No data until 1976. Number of actual observations by date: 15.
Source name:
World Development Indicators
Source organization:
World Bank staff estimates based on sources and methods in World Bank's "The Changing Wealth of Nations: Measuring Sustainable Development in the New Millennium" (2011).
Categories, topics:
Economy & Growth, Environment
Last updated:
apr 23, 2017
Indicators value changes by year
Minimum:
7.583 bln
jan 1, 1990
Maximum:
35.954 bln
jan 1, 1977
At the date of observation
Value
Absolute change
Change from previous value
jan 1, 1977
35.954 bln
+35.954 bln
0.0%
jan 1, 1978
34.459 bln
-1.494 bln
-4.16%
jan 1, 1979
22.589 bln
-11.87 bln
-34.45%
jan 1, 1980
27.248 bln
+4.659 bln
20.63%
jan 1, 1981
23.408 bln
-3.84 bln
-14.09%
jan 1, 1990
7.583 bln
-15.825 bln
-67.61%
jan 1, 1991
14.323 bln
+6.74 bln
88.88%
jan 1, 1994
14.471 bln
+147.793 mln
1.03%
jan 1, 1995
17.466 bln
+2.996 bln
20.7%
jan 1, 1996
23.458 bln
+5.992 bln
34.3%
jan 1, 1997
31.897 bln
+8.439 bln
35.98%
jan 1, 1998
25.694 bln
-6.203 bln
-19.45%
jan 1, 1999
17.215 bln
-8.48 bln
-33.0%
jan 1, 2000
24.58 bln
+7.365 bln
42.79%
jan 1, 2001
25.966 bln
+1.386 bln
5.64%
Ranking of countries by current statistics by years


Comments: