29
/
en
AIzaSyAYiBZKx7MnpbEhh9jyipgxe19OcubqV5w
April 1, 2024
209956
Nicaragua
NIC
true
2
1
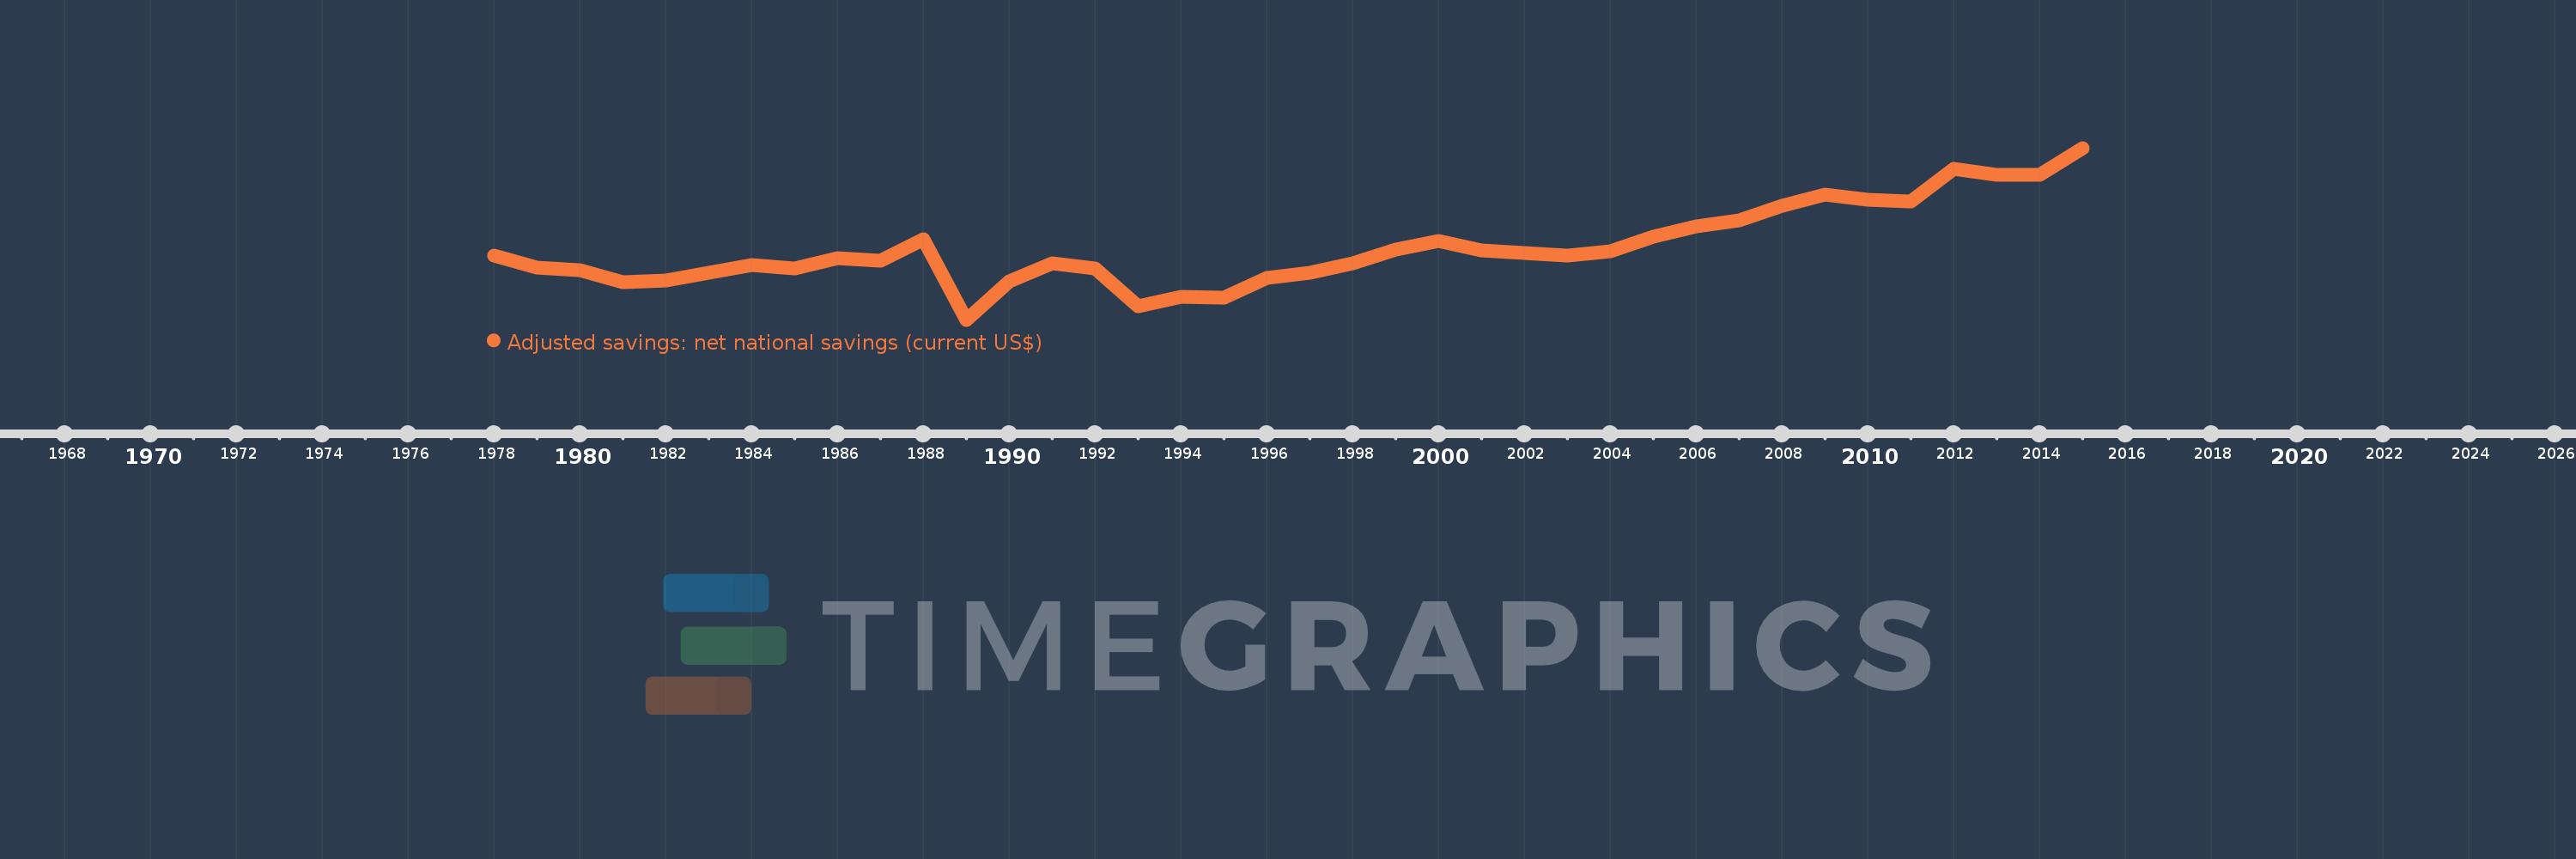
Adjusted savings: net national savings (current US$)
2015,2014,2013,2012,2011,2010,2009,2008,2007,2006,2005,2004,2003,2002,2001,2000,1999,1998,1997,1996,1995,1994,1993,1992,1991,1990,1989,1988,1987,1986,1985,1984,1983,1982,1981,1980,1979,1978
This statistics in other country:
AfghanistanAlbaniaAlgeriaAngolaAntigua and BarbudaArgentinaArmeniaAustraliaAustriaAzerbaijanBahamas, TheBahrainBangladeshBarbadosBelarusBelgiumBelizeBeninBermudaBhutanBoliviaBosnia and HerzegovinaBotswanaBrazilBrunei DarussalamBulgariaBurkina FasoBurundiCabo VerdeCambodiaCameroonCanadaCentral African RepublicChadChileChinaColombiaComorosCongo, Dem. Rep.Congo, Rep.Costa RicaCote d'IvoireCroatiaCyprusCzech RepublicDenmarkDjiboutiDominicaDominican RepublicEcuadorEgypt, Arab Rep.El SalvadorEquatorial GuineaEritreaEstoniaEthiopiaFijiFinlandFranceGabonGambia, TheGeorgiaGermanyGhanaGreeceGrenadaGuatemalaGuineaGuinea-BissauGuyanaHaitiHondurasHong Kong SAR, ChinaHungaryIcelandIndiaIndonesiaIran, Islamic Rep.IraqIrelandIsraelItalyJamaicaJapanJordanKazakhstanKenyaKiribatiKorea, Rep.KosovoKuwaitKyrgyz RepublicLao PDRLatviaLebanonLesothoLiberiaLibyaLithuaniaLuxembourgMacao SAR, ChinaMacedonia, FYRMadagascarMalawiMalaysiaMaldivesMaliMaltaMauritaniaMauritiusMexicoMoldovaMongoliaMontenegroMoroccoMozambiqueNamibiaNepalNetherlandsNew ZealandNicaraguaNigerNigeriaNorwayOmanPakistanPanamaPapua New GuineaParaguayPeruPhilippinesPolandPortugalQatarRomaniaRussian FederationRwandaSaudi ArabiaSenegalSerbiaSeychellesSierra LeoneSingaporeSlovak RepublicSloveniaSolomon IslandsSouth AfricaSpainSri LankaSt. Kitts and NevisSt. LuciaSt. Vincent and the GrenadinesSudanSurinameSwazilandSwedenSwitzerlandSyrian Arab RepublicTajikistanTanzaniaThailandTimor-LesteTogoTongaTrinidad and TobagoTunisiaTurkeyTurkmenistanUgandaUkraineUnited KingdomUnited StatesUruguayVanuatuVenezuela, RBVietnamWest Bank and GazaYemen, Rep.ZambiaZimbabwe Timeline:
This timeline shows a graph from 1978 to 2015 of Nicaragua. No data until 1977. Number of actual observations by date: 38.
Source name:
World Development Indicators
Source organization:
World Bank staff estimates based on sources and methods in World Bank's "The Changing Wealth of Nations: Measuring Sustainable Development in the New Millennium" (2011).
Categories, topics:
Economy & Growth, Environment
Last updated:
apr 23, 2017
Indicators value changes by year
Minimum:
-695.606 mln
jan 1, 1989
Maximum:
1.799 bln
jan 1, 2015
At the date of observation
Value
Absolute change
Change from previous value
jan 1, 1978
230.695 mln
+230.695 mln
0.0%
jan 1, 1979
65.784 mln
-164.912 mln
-71.48%
jan 1, 1980
22.532 mln
-43.252 mln
-65.75%
jan 1, 1981
-152.057 mln
-174.589 mln
-774.84%
jan 1, 1982
-126.691 mln
+25.366 mln
-16.68%
jan 1, 1983
-11.09 mln
+115.6 mln
-91.25%
jan 1, 1984
100.097 mln
+111.188 mln
-1.0K%
jan 1, 1985
43.157 mln
-56.941 mln
-56.89%
jan 1, 1986
201.981 mln
+158.824 mln
368.02%
jan 1, 1987
155.305 mln
-46.675 mln
-23.11%
jan 1, 1988
478.405 mln
+323.1 mln
208.04%
jan 1, 1989
-695.606 mln
-1.174 bln
-245.4%
jan 1, 1990
-134.12 mln
+561.487 mln
-80.72%
jan 1, 1991
120.579 mln
+254.699 mln
-189.9%
jan 1, 1992
51.598 mln
-68.981 mln
-57.21%
jan 1, 1993
-495.979 mln
-547.578 mln
-1.06K%
jan 1, 1994
-362.089 mln
+133.89 mln
-27.0%
jan 1, 1995
-378.9 mln
-16.811 mln
4.64%
jan 1, 1996
-91.471 mln
+287.429 mln
-75.86%
jan 1, 1997
-7.861 mln
+83.61 mln
-91.41%
jan 1, 1998
124.473 mln
+132.334 mln
-1.68K%
jan 1, 1999
326.428 mln
+201.954 mln
162.25%
jan 1, 2000
442.891 mln
+116.463 mln
35.68%
jan 1, 2001
314.227 mln
-128.663 mln
-29.05%
jan 1, 2002
277.898 mln
-36.329 mln
-11.56%
jan 1, 2003
234.175 mln
-43.723 mln
-15.73%
jan 1, 2004
302.503 mln
+68.328 mln
29.18%
jan 1, 2005
515.636 mln
+213.133 mln
70.46%
jan 1, 2006
665.305 mln
+149.668 mln
29.03%
jan 1, 2007
742.782 mln
+77.477 mln
11.65%
jan 1, 2008
963.555 mln
+220.774 mln
29.72%
jan 1, 2009
1.126 bln
+162.692 mln
16.88%
jan 1, 2010
1.053 bln
-73.394 mln
-6.52%
jan 1, 2011
1.019 bln
-34.182 mln
-3.25%
jan 1, 2012
1.493 bln
+474.519 mln
46.58%
jan 1, 2013
1.409 bln
-83.902 mln
-5.62%
jan 1, 2014
1.407 bln
-2.529 mln
-0.18%
jan 1, 2015
1.799 bln
+391.968 mln
27.86%
Ranking of countries by current statistics by years


Comments: