29
/
en
AIzaSyAYiBZKx7MnpbEhh9jyipgxe19OcubqV5w
April 1, 2024
266516
Trinidad and Tobago
TTO
true
2
1
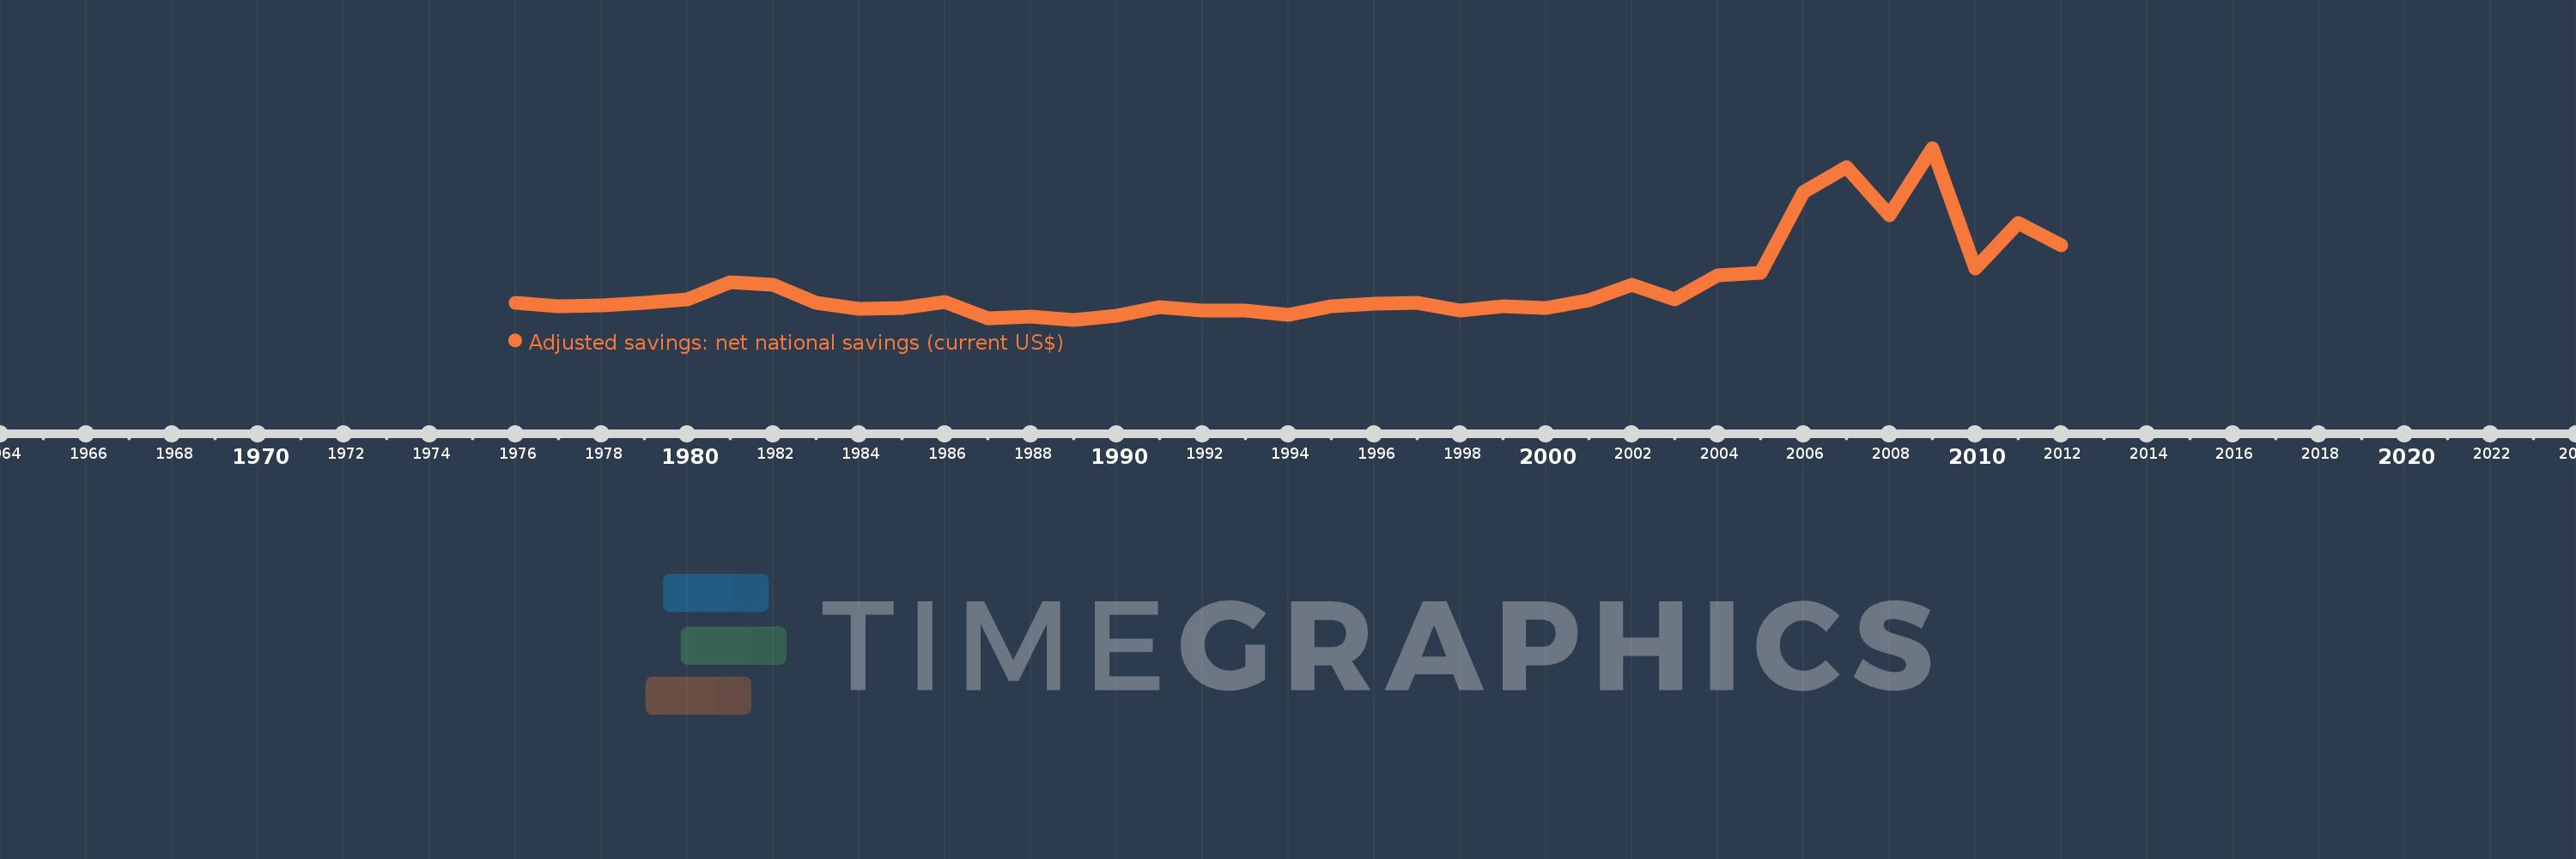
Adjusted savings: net national savings (current US$)
2012,2011,2010,2009,2008,2007,2006,2005,2004,2003,2002,2001,2000,1999,1998,1997,1996,1995,1994,1993,1992,1991,1990,1989,1988,1987,1986,1985,1984,1983,1982,1981,1980,1979,1978,1977,1976
This statistics in other country:
AfghanistanAlbaniaAlgeriaAngolaAntigua and BarbudaArgentinaArmeniaAustraliaAustriaAzerbaijanBahamas, TheBahrainBangladeshBarbadosBelarusBelgiumBelizeBeninBermudaBhutanBoliviaBosnia and HerzegovinaBotswanaBrazilBrunei DarussalamBulgariaBurkina FasoBurundiCabo VerdeCambodiaCameroonCanadaCentral African RepublicChadChileChinaColombiaComorosCongo, Dem. Rep.Congo, Rep.Costa RicaCote d'IvoireCroatiaCyprusCzech RepublicDenmarkDjiboutiDominicaDominican RepublicEcuadorEgypt, Arab Rep.El SalvadorEquatorial GuineaEritreaEstoniaEthiopiaFijiFinlandFranceGabonGambia, TheGeorgiaGermanyGhanaGreeceGrenadaGuatemalaGuineaGuinea-BissauGuyanaHaitiHondurasHong Kong SAR, ChinaHungaryIcelandIndiaIndonesiaIran, Islamic Rep.IraqIrelandIsraelItalyJamaicaJapanJordanKazakhstanKenyaKiribatiKorea, Rep.KosovoKuwaitKyrgyz RepublicLao PDRLatviaLebanonLesothoLiberiaLibyaLithuaniaLuxembourgMacao SAR, ChinaMacedonia, FYRMadagascarMalawiMalaysiaMaldivesMaliMaltaMauritaniaMauritiusMexicoMoldovaMongoliaMontenegroMoroccoMozambiqueNamibiaNepalNetherlandsNew ZealandNicaraguaNigerNigeriaNorwayOmanPakistanPanamaPapua New GuineaParaguayPeruPhilippinesPolandPortugalQatarRomaniaRussian FederationRwandaSaudi ArabiaSenegalSerbiaSeychellesSierra LeoneSingaporeSlovak RepublicSloveniaSolomon IslandsSouth AfricaSpainSri LankaSt. Kitts and NevisSt. LuciaSt. Vincent and the GrenadinesSudanSurinameSwazilandSwedenSwitzerlandSyrian Arab RepublicTajikistanTanzaniaThailandTimor-LesteTogoTongaTrinidad and TobagoTunisiaTurkeyTurkmenistanUgandaUkraineUnited KingdomUnited StatesUruguayVanuatuVenezuela, RBVietnamWest Bank and GazaYemen, Rep.ZambiaZimbabwe Timeline:
This timeline shows a graph from 1976 to 2012 of Trinidad and Tobago. No data until 1975. Number of actual observations by date: 37.
Source name:
World Development Indicators
Source organization:
World Bank staff estimates based on sources and methods in World Bank's "The Changing Wealth of Nations: Measuring Sustainable Development in the New Millennium" (2011).
Categories, topics:
Economy & Growth, Environment
Last updated:
apr 23, 2017
Indicators value changes by year
Minimum:
1.614 mln
jan 1, 1989
Maximum:
8.794 bln
jan 1, 2009
At the date of observation
Value
Absolute change
Change from previous value
jan 1, 1976
866.053 mln
+866.053 mln
0.0%
jan 1, 1977
678.101 mln
-187.952 mln
-21.7%
jan 1, 1978
756.912 mln
+78.81 mln
11.62%
jan 1, 1979
881.806 mln
+124.894 mln
16.5%
jan 1, 1980
1.043 bln
+161.689 mln
18.34%
jan 1, 1981
1.925 bln
+881.536 mln
84.48%
jan 1, 1982
1.77 bln
-155.014 mln
-8.05%
jan 1, 1983
879.319 mln
-890.699 mln
-50.32%
jan 1, 1984
577.477 mln
-301.842 mln
-34.33%
jan 1, 1985
606.828 mln
+29.351 mln
5.08%
jan 1, 1986
908.033 mln
+301.205 mln
49.64%
jan 1, 1987
86.973 mln
-821.06 mln
-90.42%
jan 1, 1988
184.957 mln
+97.984 mln
112.66%
jan 1, 1989
1.614 mln
-183.343 mln
-99.13%
jan 1, 1990
208.068 mln
+206.454 mln
12.79K%
jan 1, 1991
666.764 mln
+458.695 mln
220.45%
jan 1, 1992
464.38 mln
-202.384 mln
-30.35%
jan 1, 1993
492.949 mln
+28.569 mln
6.15%
jan 1, 1994
268.686 mln
-224.263 mln
-45.49%
jan 1, 1995
691.413 mln
+422.727 mln
157.33%
jan 1, 1996
837.66 mln
+146.247 mln
21.15%
jan 1, 1997
864.061 mln
+26.401 mln
3.15%
jan 1, 1998
478.881 mln
-385.18 mln
-44.58%
jan 1, 1999
674.921 mln
+196.04 mln
40.94%
jan 1, 2000
613.118 mln
-61.803 mln
-9.16%
jan 1, 2001
1.01 bln
+396.421 mln
64.66%
jan 1, 2002
1.78 bln
+770.417 mln
76.31%
jan 1, 2003
1.046 bln
-734.23 mln
-41.25%
jan 1, 2004
2.258 bln
+1.213 bln
115.97%
jan 1, 2005
2.418 bln
+159.939 mln
7.08%
jan 1, 2006
6.56 bln
+4.142 bln
171.26%
jan 1, 2007
7.831 bln
+1.27 bln
19.37%
jan 1, 2008
5.339 bln
-2.491 bln
-31.82%
jan 1, 2009
8.794 bln
+3.455 bln
64.71%
jan 1, 2010
2.616 bln
-6.178 bln
-70.26%
jan 1, 2011
4.954 bln
+2.338 bln
89.38%
jan 1, 2012
3.81 bln
-1.143 bln
-23.08%
Ranking of countries by current statistics by years


Comments: