30
/
AIzaSyAYiBZKx7MnpbEhh9jyipgxe19OcubqV5w
April 1, 2024
119575
Djibouti
DJI
true
2
1
Adjusted savings: net national savings (current US$)
2006,2005,2004,2003,2002,2001,2000,1999,1998,1997,1996,1995,1994,1993,1992
Download
Global statistics library →Djibouti →

Adjusted savings: net national savings (current US$)

This statistics in other country:

AfghanistanAlbaniaAlgeriaAngolaAntigua and BarbudaArgentinaArmeniaAustraliaAustriaAzerbaijanBahamas, TheBahrainBangladeshBarbadosBelarusBelgiumBelizeBeninBermudaBhutanBoliviaBosnia and HerzegovinaBotswanaBrazilBrunei DarussalamBulgariaBurkina FasoBurundiCabo VerdeCambodiaCameroonCanadaCentral African RepublicChadChileChinaColombiaComorosCongo, Dem. Rep.Congo, Rep.Costa RicaCote d'IvoireCroatiaCyprusCzech RepublicDenmarkDjiboutiDominicaDominican RepublicEcuadorEgypt, Arab Rep.El SalvadorEquatorial GuineaEritreaEstoniaEthiopiaFijiFinlandFranceGabonGambia, TheGeorgiaGermanyGhanaGreeceGrenadaGuatemalaGuineaGuinea-BissauGuyanaHaitiHondurasHong Kong SAR, ChinaHungaryIcelandIndiaIndonesiaIran, Islamic Rep.IraqIrelandIsraelItalyJamaicaJapanJordanKazakhstanKenyaKiribatiKorea, Rep.KosovoKuwaitKyrgyz RepublicLao PDRLatviaLebanonLesothoLiberiaLibyaLithuaniaLuxembourgMacao SAR, ChinaMacedonia, FYRMadagascarMalawiMalaysiaMaldivesMaliMaltaMauritaniaMauritiusMexicoMoldovaMongoliaMontenegroMoroccoMozambiqueNamibiaNepalNetherlandsNew ZealandNicaraguaNigerNigeriaNorwayOmanPakistanPanamaPapua New GuineaParaguayPeruPhilippinesPolandPortugalQatarRomaniaRussian FederationRwandaSaudi ArabiaSenegalSerbiaSeychellesSierra LeoneSingaporeSlovak RepublicSloveniaSolomon IslandsSouth AfricaSpainSri LankaSt. Kitts and NevisSt. LuciaSt. Vincent and the GrenadinesSudanSurinameSwazilandSwedenSwitzerlandSyrian Arab RepublicTajikistanTanzaniaThailandTimor-LesteTogoTongaTrinidad and TobagoTunisiaTurkeyTurkmenistanUgandaUkraineUnited KingdomUnited StatesUruguayVanuatuVenezuela, RBVietnamWest Bank and GazaYemen, Rep.ZambiaZimbabwe

Timeline:

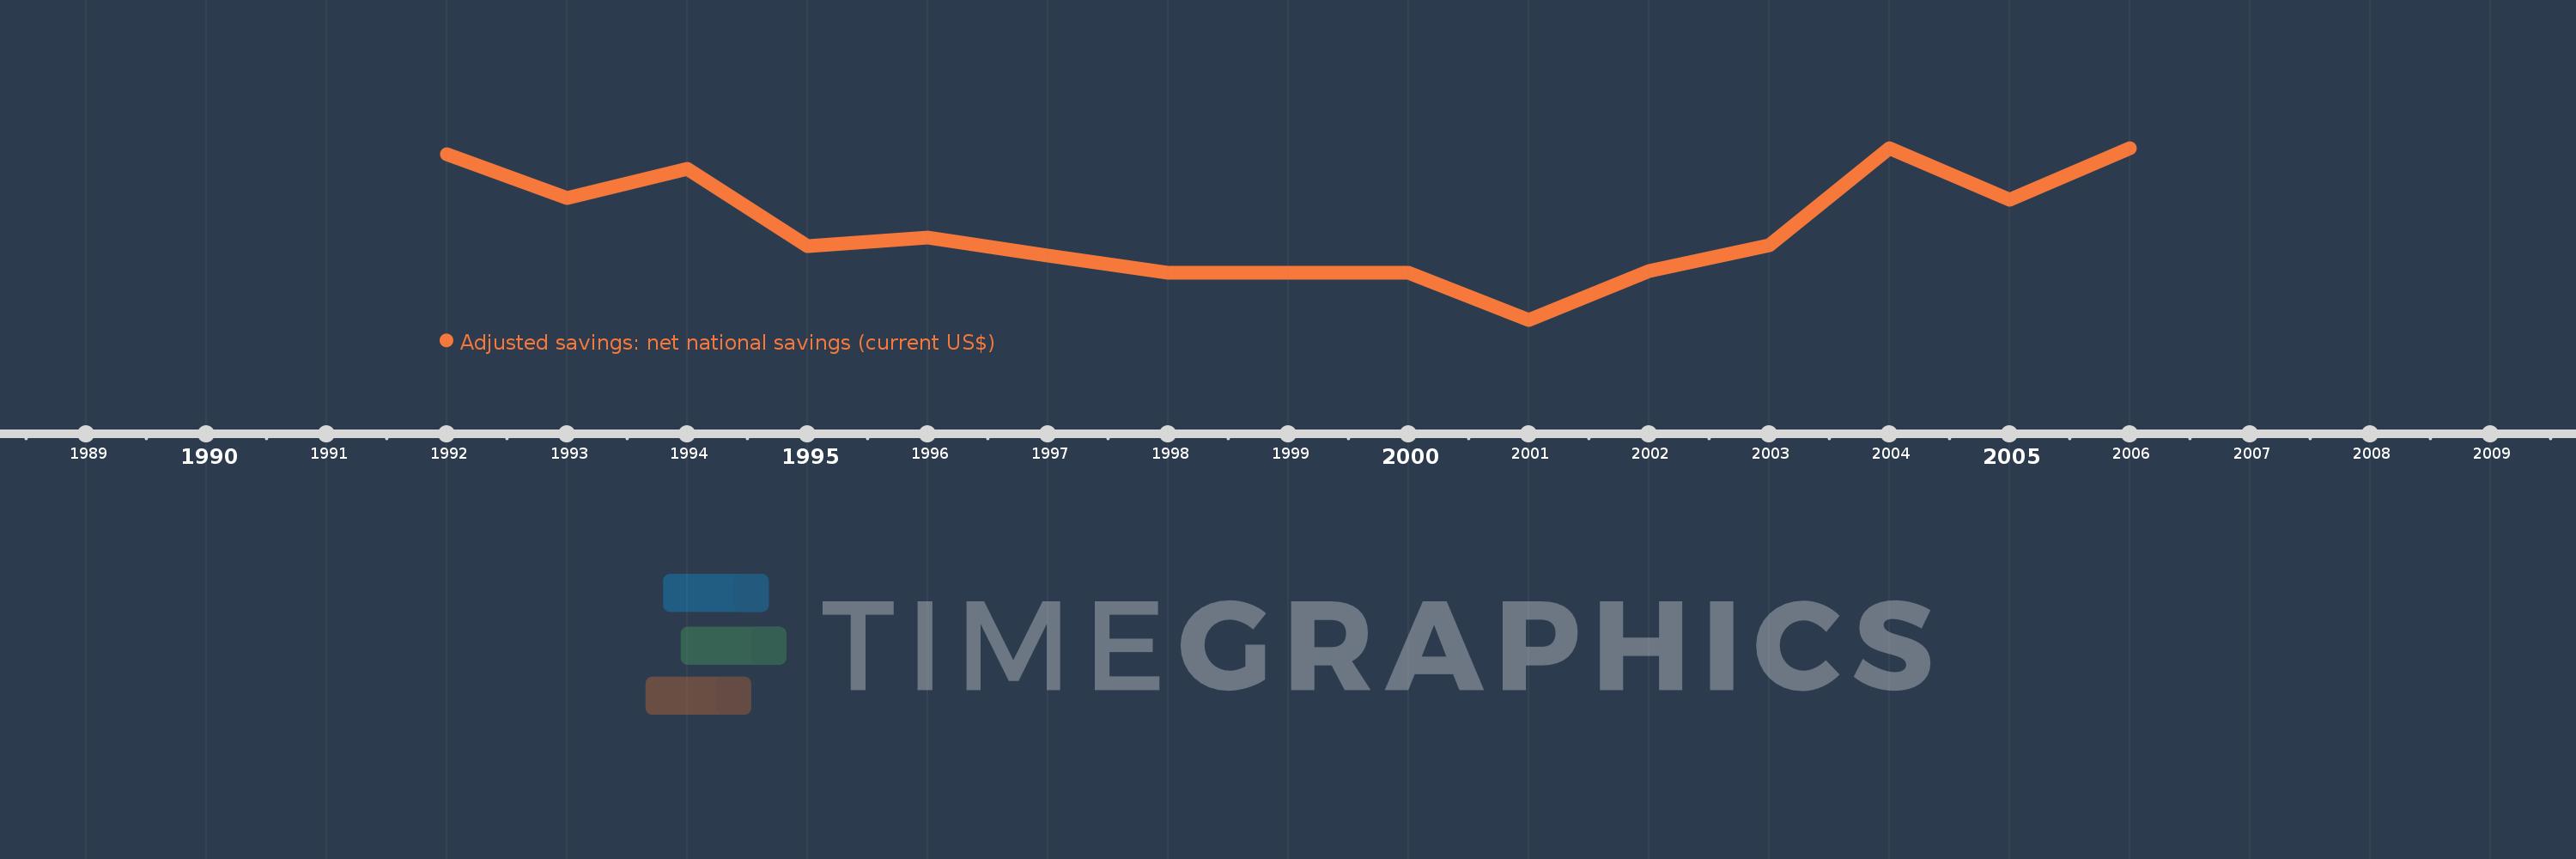
This timeline shows a graph from 1992 to 2006 of Djibouti. No data until 1991. Number of actual observations by date: 15.

Source name:

World Development Indicators

Source organization:

World Bank staff estimates based on sources and methods in World Bank's "The Changing Wealth of Nations: Measuring Sustainable Development in the New Millennium" (2011).

Categories, topics:

Economy & Growth, Environment

Last updated:

apr 23, 2017

Indicators value changes by year

Meaning:
76.866 mln
Minimum:
13.616 mln
jan 1, 2001
Maximum:
131.226 mln
jan 1, 2006
At the date of observation
Value
Absolute change
Change from the previous value
jan 1, 1992
127.039 mln
+127.039 mln
0.0%
jan 1, 1993
96.9 mln
-30.139 mln
-23.72%
jan 1, 1994
117.161 mln
+20.262 mln
20.91%
jan 1, 1995
63.964 mln
-53.197 mln
-45.41%
jan 1, 1996
69.902 mln
+5.938 mln
9.28%
jan 1, 1997
57.428 mln
-12.474 mln
-17.85%
jan 1, 1998
45.52 mln
-11.908 mln
-20.73%
jan 1, 1999
46.073 mln
+552.551K
1.21%
jan 1, 2000
45.637 mln
-436.114K
-0.95%
jan 1, 2001
13.616 mln
-32.021 mln
-70.16%
jan 1, 2002
47.074 mln
+33.458 mln
245.72%
jan 1, 2003
64.609 mln
+17.535 mln
37.25%
jan 1, 2004
130.929 mln
+66.319 mln
102.65%
jan 1, 2005
95.91 mln
-35.019 mln
-26.75%
jan 1, 2006
131.226 mln
+35.316 mln
36.82%

Ranking of countries by current statistics by years