29
/
en
AIzaSyAYiBZKx7MnpbEhh9jyipgxe19OcubqV5w
April 1, 2024
279478
Vanuatu
VUT
true
2
1
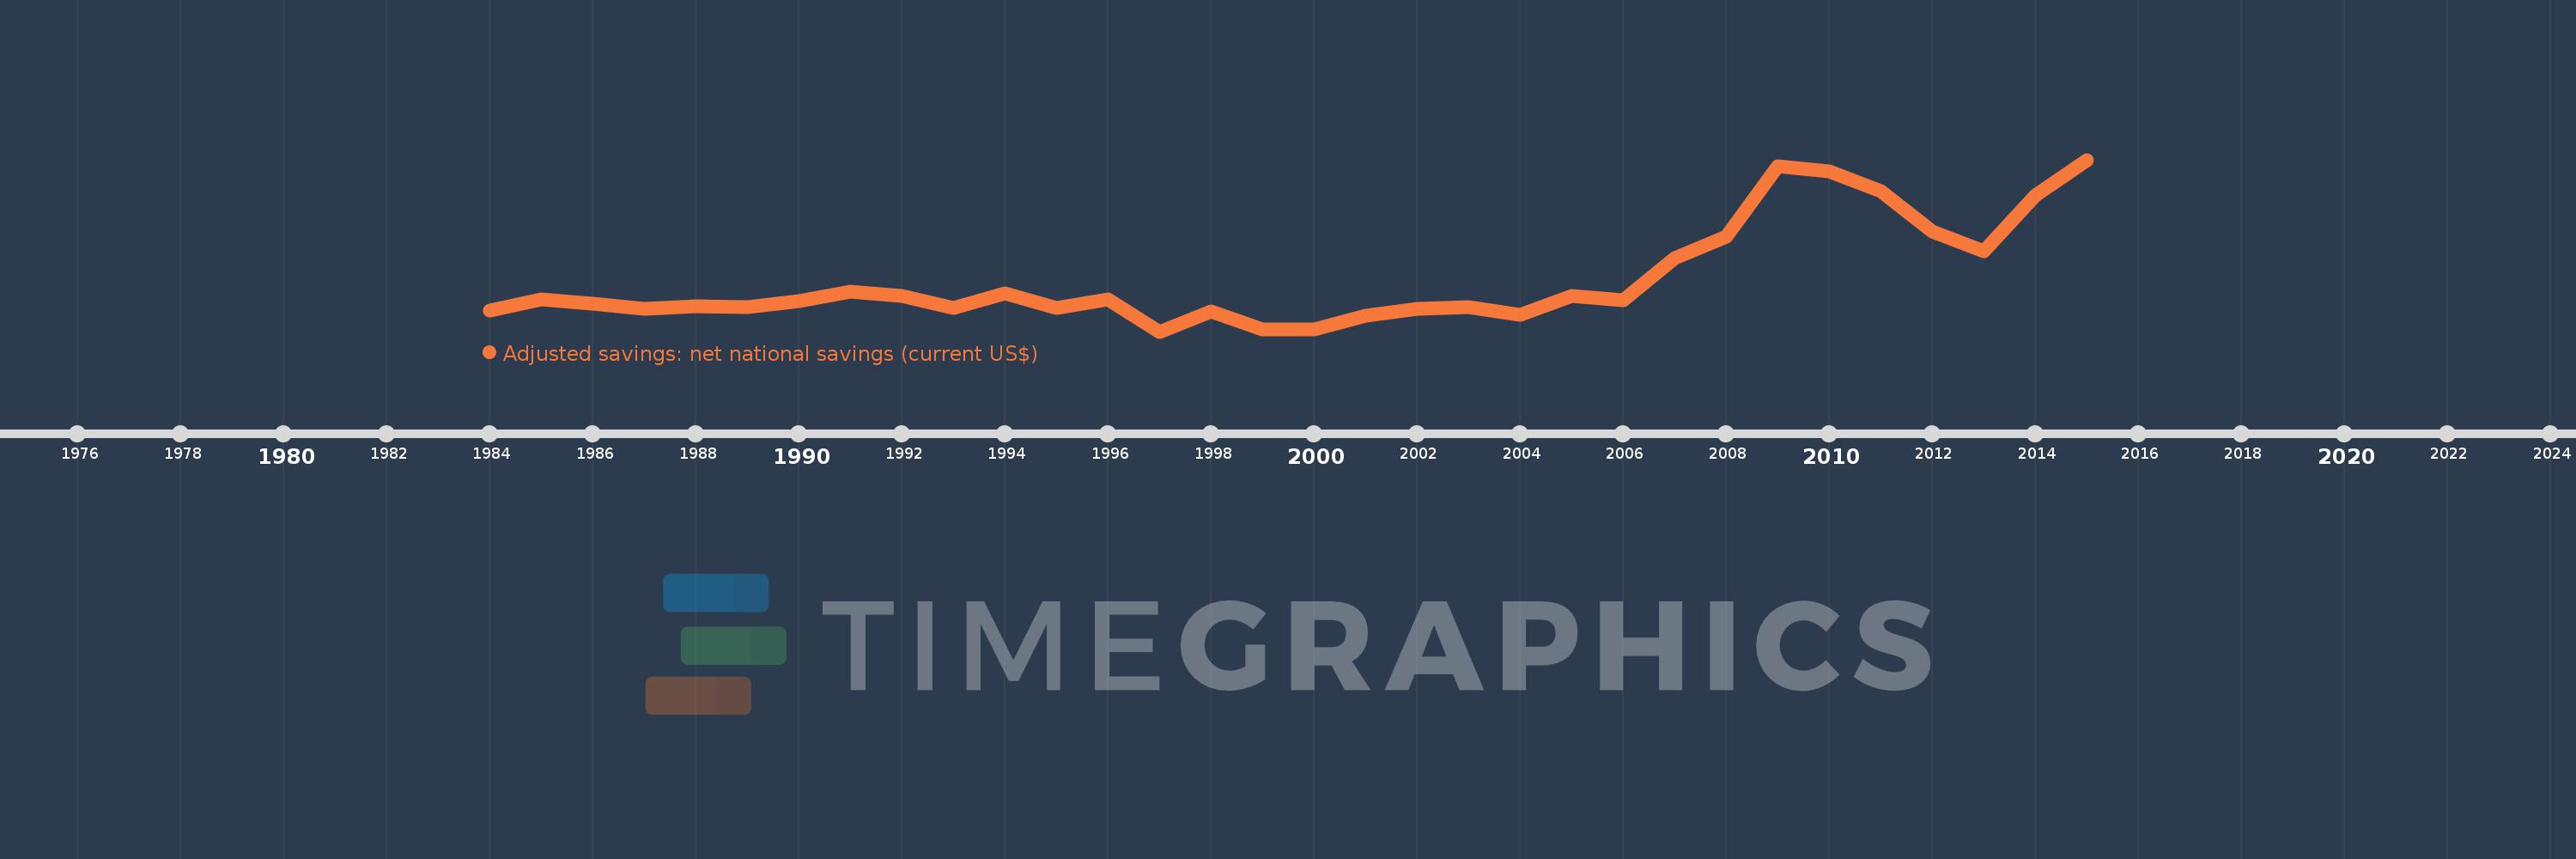
Adjusted savings: net national savings (current US$)
2015,2014,2013,2012,2011,2010,2009,2008,2007,2006,2005,2004,2003,2002,2001,2000,1999,1998,1997,1996,1995,1994,1993,1992,1991,1990,1989,1988,1987,1986,1985,1984
This statistics in other country:
AfghanistanAlbaniaAlgeriaAngolaAntigua and BarbudaArgentinaArmeniaAustraliaAustriaAzerbaijanBahamas, TheBahrainBangladeshBarbadosBelarusBelgiumBelizeBeninBermudaBhutanBoliviaBosnia and HerzegovinaBotswanaBrazilBrunei DarussalamBulgariaBurkina FasoBurundiCabo VerdeCambodiaCameroonCanadaCentral African RepublicChadChileChinaColombiaComorosCongo, Dem. Rep.Congo, Rep.Costa RicaCote d'IvoireCroatiaCyprusCzech RepublicDenmarkDjiboutiDominicaDominican RepublicEcuadorEgypt, Arab Rep.El SalvadorEquatorial GuineaEritreaEstoniaEthiopiaFijiFinlandFranceGabonGambia, TheGeorgiaGermanyGhanaGreeceGrenadaGuatemalaGuineaGuinea-BissauGuyanaHaitiHondurasHong Kong SAR, ChinaHungaryIcelandIndiaIndonesiaIran, Islamic Rep.IraqIrelandIsraelItalyJamaicaJapanJordanKazakhstanKenyaKiribatiKorea, Rep.KosovoKuwaitKyrgyz RepublicLao PDRLatviaLebanonLesothoLiberiaLibyaLithuaniaLuxembourgMacao SAR, ChinaMacedonia, FYRMadagascarMalawiMalaysiaMaldivesMaliMaltaMauritaniaMauritiusMexicoMoldovaMongoliaMontenegroMoroccoMozambiqueNamibiaNepalNetherlandsNew ZealandNicaraguaNigerNigeriaNorwayOmanPakistanPanamaPapua New GuineaParaguayPeruPhilippinesPolandPortugalQatarRomaniaRussian FederationRwandaSaudi ArabiaSenegalSerbiaSeychellesSierra LeoneSingaporeSlovak RepublicSloveniaSolomon IslandsSouth AfricaSpainSri LankaSt. Kitts and NevisSt. LuciaSt. Vincent and the GrenadinesSudanSurinameSwazilandSwedenSwitzerlandSyrian Arab RepublicTajikistanTanzaniaThailandTimor-LesteTogoTongaTrinidad and TobagoTunisiaTurkeyTurkmenistanUgandaUkraineUnited KingdomUnited StatesUruguayVanuatuVenezuela, RBVietnamWest Bank and GazaYemen, Rep.ZambiaZimbabwe Timeline:
This timeline shows a graph from 1984 to 2015 of Vanuatu. No data until 1983. Number of actual observations by date: 32.
Source name:
World Development Indicators
Source organization:
World Bank staff estimates based on sources and methods in World Bank's "The Changing Wealth of Nations: Measuring Sustainable Development in the New Millennium" (2011).
Categories, topics:
Economy & Growth, Environment
Last updated:
apr 23, 2017
Indicators value changes by year
Minimum:
-14.622 mln
jan 1, 1997
Maximum:
163.319 mln
jan 1, 2015
At the date of observation
Value
Absolute change
Change from previous value
jan 1, 1984
6.97 mln
+6.97 mln
0.0%
jan 1, 1985
18.347 mln
+11.377 mln
163.24%
jan 1, 1986
14.63 mln
-3.717 mln
-20.26%
jan 1, 1987
8.656 mln
-5.974 mln
-40.83%
jan 1, 1988
12.01 mln
+3.353 mln
38.74%
jan 1, 1989
10.417 mln
-1.592 mln
-13.26%
jan 1, 1990
16.634 mln
+6.217 mln
59.68%
jan 1, 1991
26.968 mln
+10.334 mln
62.13%
jan 1, 1992
22.395 mln
-4.573 mln
-16.96%
jan 1, 1993
10.285 mln
-12.109 mln
-54.07%
jan 1, 1994
25.076 mln
+14.79 mln
143.8%
jan 1, 1995
9.407 mln
-15.668 mln
-62.48%
jan 1, 1996
19.022 mln
+9.615 mln
102.21%
jan 1, 1997
-14.622 mln
-33.644 mln
-176.87%
jan 1, 1998
6.002 mln
+20.624 mln
-141.05%
jan 1, 1999
-12.678 mln
-18.679 mln
-311.23%
jan 1, 2000
-12.8 mln
-122.647K
0.97%
jan 1, 2001
1.603 mln
+14.403 mln
-112.52%
jan 1, 2002
8.796 mln
+7.194 mln
448.9%
jan 1, 2003
10.309 mln
+1.513 mln
17.2%
jan 1, 2004
2.776 mln
-7.534 mln
-73.08%
jan 1, 2005
22.092 mln
+19.317 mln
695.95%
jan 1, 2006
18.083 mln
-4.009 mln
-18.15%
jan 1, 2007
61.692 mln
+43.608 mln
241.15%
jan 1, 2008
83.889 mln
+22.197 mln
35.98%
jan 1, 2009
156.752 mln
+72.863 mln
86.86%
jan 1, 2010
150.898 mln
-5.854 mln
-3.73%
jan 1, 2011
130.951 mln
-19.947 mln
-13.22%
jan 1, 2012
89.08 mln
-41.871 mln
-31.97%
jan 1, 2013
68.122 mln
-20.958 mln
-23.53%
jan 1, 2014
125.996 mln
+57.874 mln
84.96%
jan 1, 2015
163.319 mln
+37.323 mln
29.62%
Ranking of countries by current statistics by years


Comments: